
The climate transition has become a key issue on municipal agendas. According to recent surveys of local elected officials, the fight against climate change consistently ranks among the top three priorities for current and future terms of office. Territorial Climate-Air-Energy Plans (PCAETs) are becoming widespread, green budgets are appearing in deliberations, and candidates in municipal elections are competing to make environmental commitments.
But behind this facade of unanimity, the reality on the ground tells a different story. Many local governments are struggling to translate their climate goals into measurable results. The problem isn’t a lack of will. It’s structural: you can’t manage what you can’t measure.
Few mayors fail to mention the ecological transition in their platforms. Regulatory requirements—such as the PCAET, the National Low-Carbon Strategy (SNBC), and the Climate and Resilience Act—are pushing local governments to develop a local response to climate challenges. But there is a significant gap between the obligation to produce a plan and the ability to implement it.
The obstacles most frequently cited by elected officials are well known: strained budgets, a lack of in-house technical expertise, and a growing body of regulations that doesn’t always provide the tools needed to comply with them. The result is paradoxical: local governments spend millions on green spaces, sustainable transportation, and energy-efficient renovations, yet are unable to demonstrate precisely how these investments impact the local climate.
The central question is not “Should we take action on climate change?”—there is a consensus on that. The real practical question is: How can we prove that the actions we’ve taken are producing results?
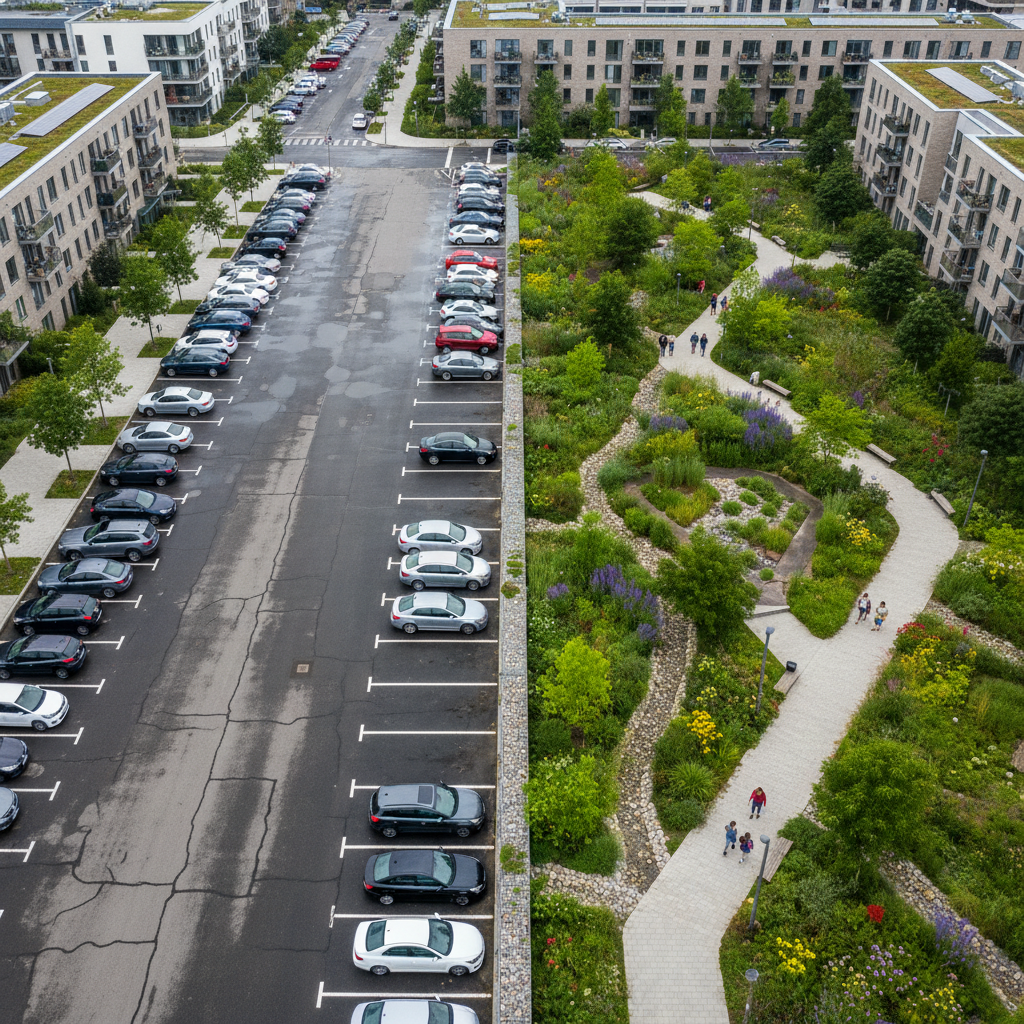
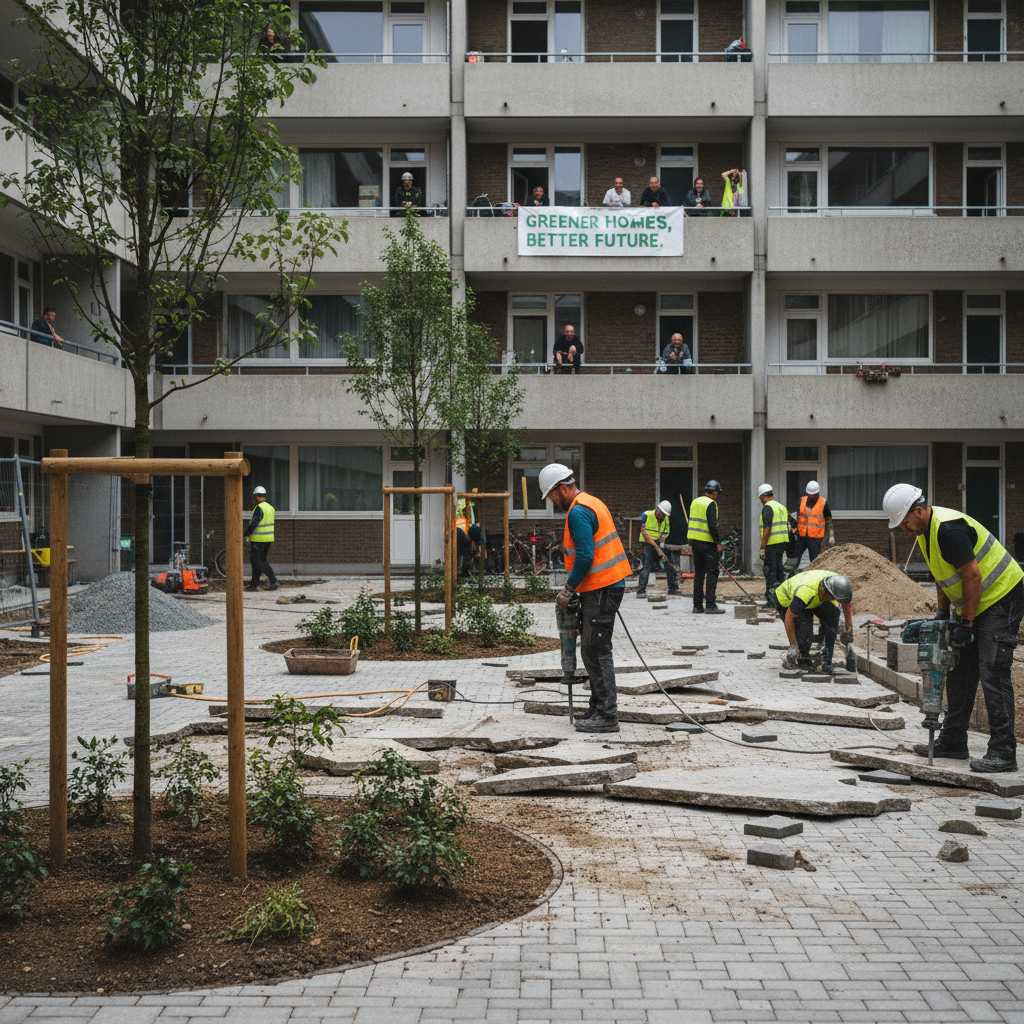
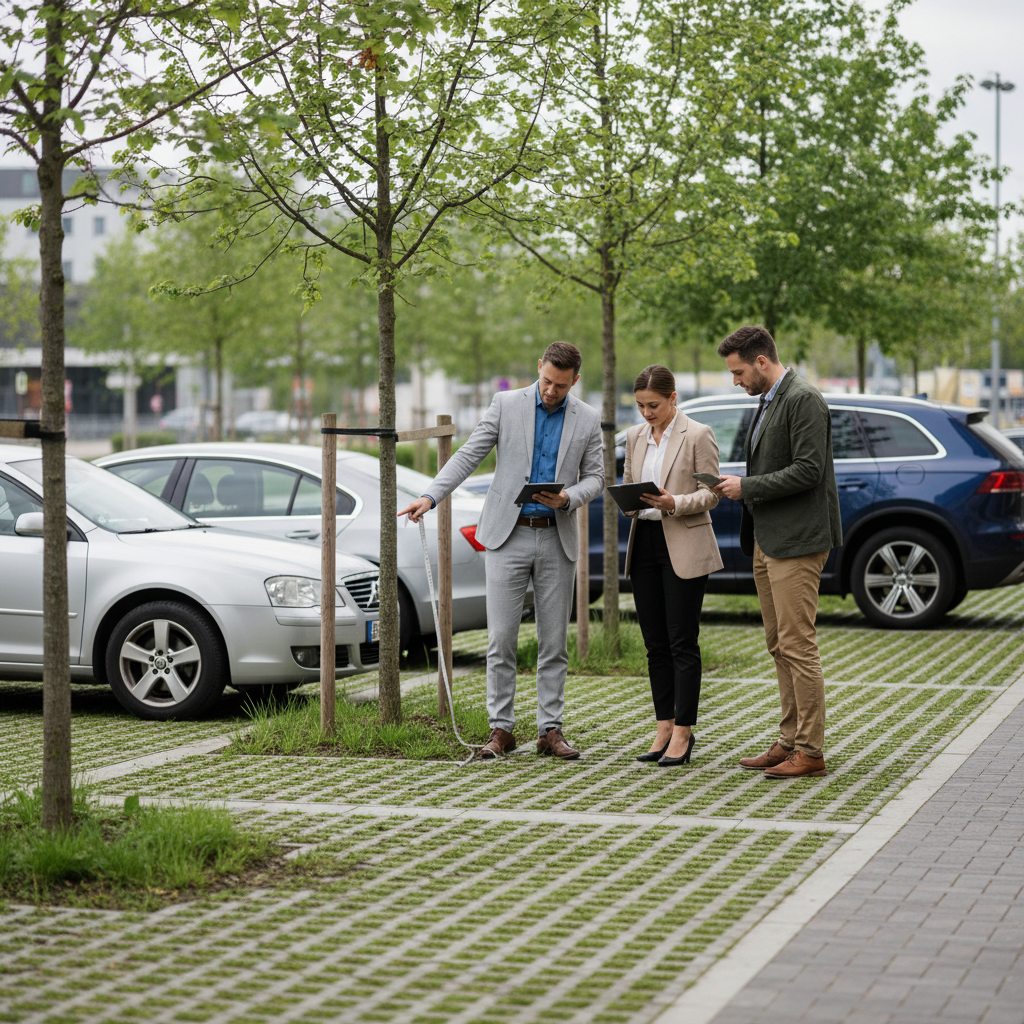
An elected official who plants 500 trees can highlight that number. But how many tons of CO2 will those trees sequester after 25 years? What impact will they have on the perceived temperature in the neighborhood in question? How much of the area has actually been converted from impervious to permeable surfaces? Without answers to these questions, climate policy remains nothing more than lip service.
When a chief financial officer manages a municipal budget, they have access to precise, auditable metrics that are tracked over time. They can compare revenues and expenditures year over year, identify areas where costs are running high, and justify their decisions to the city council.
Climate policy deserves the same level of rigor. Managing the ecological transition as a structured public policy requires objective, reproducible, and comparable indicators over time. This is essential for moving from intention to proof.
In practical terms, fostering a data-driven culture in local climate governance means:
The soils and vegetation of an area serve as carbon sinks, the value of which is rarely quantified. Yet a simple assessment makes it possible to map the CO2 stocks present throughout an entire municipality: meadows, urban forests, parks, tree-lined streets, and private gardens.
Beyond existing carbon stocks, carbon sequestration—that is, a project’s ability to capture additional CO₂—is a directly actionable performance indicator. This principle is the foundation of the “Low-Carbon Tree-Lined City” Label, which enables local governments to generate carbon credits through tree-planting projects.
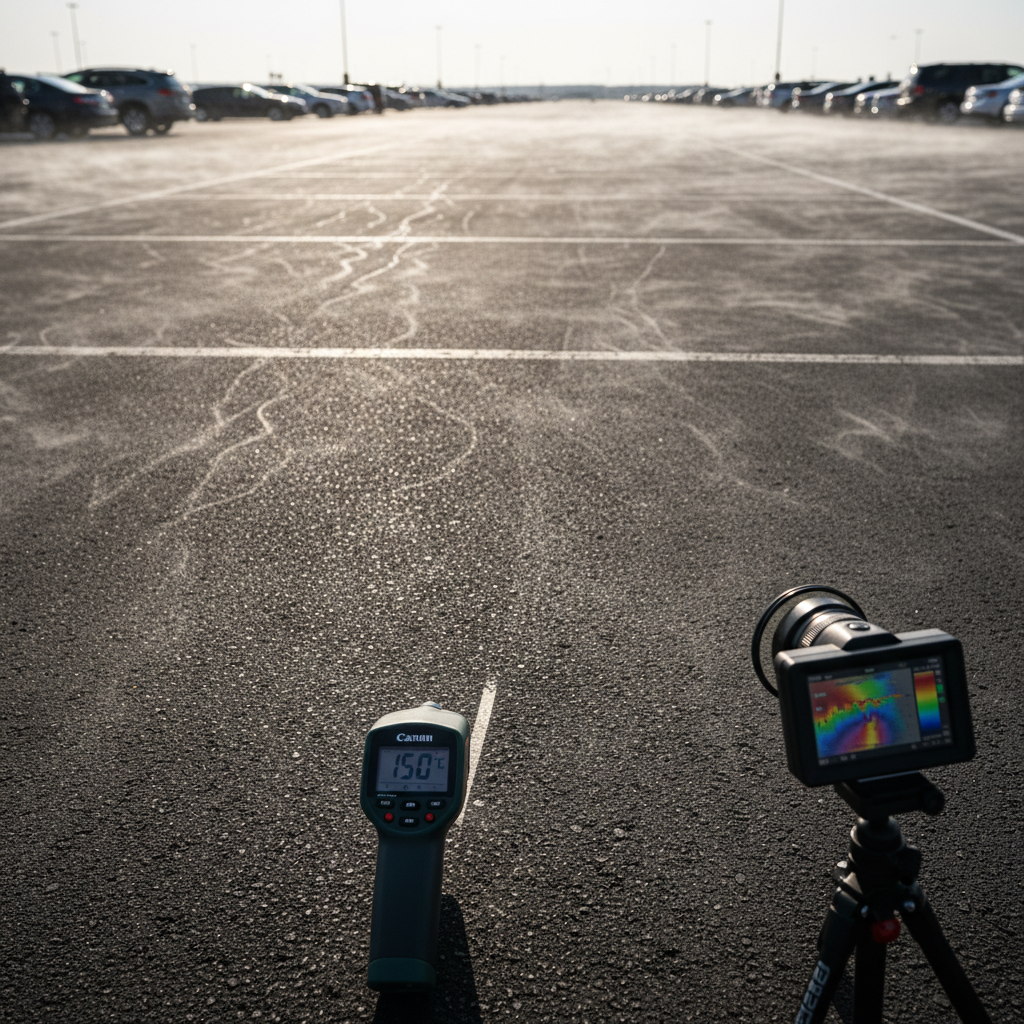
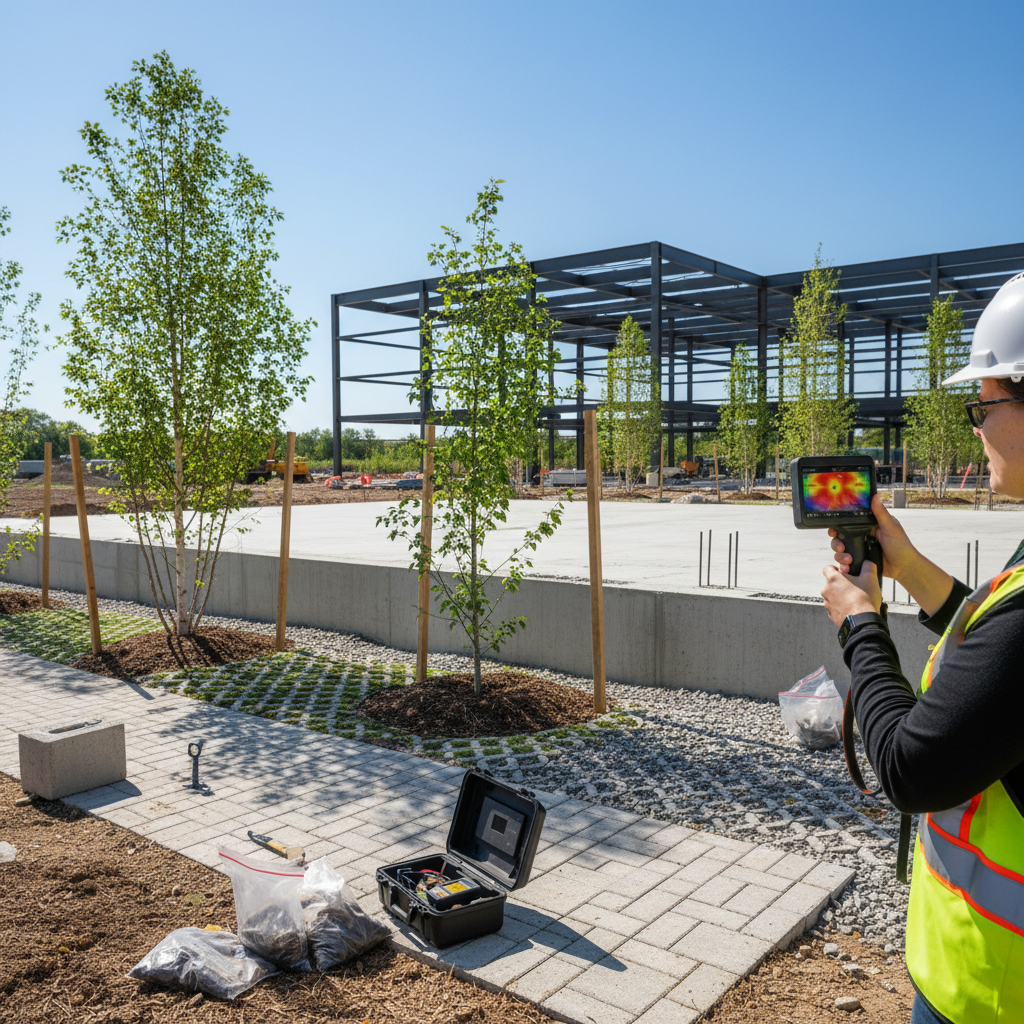
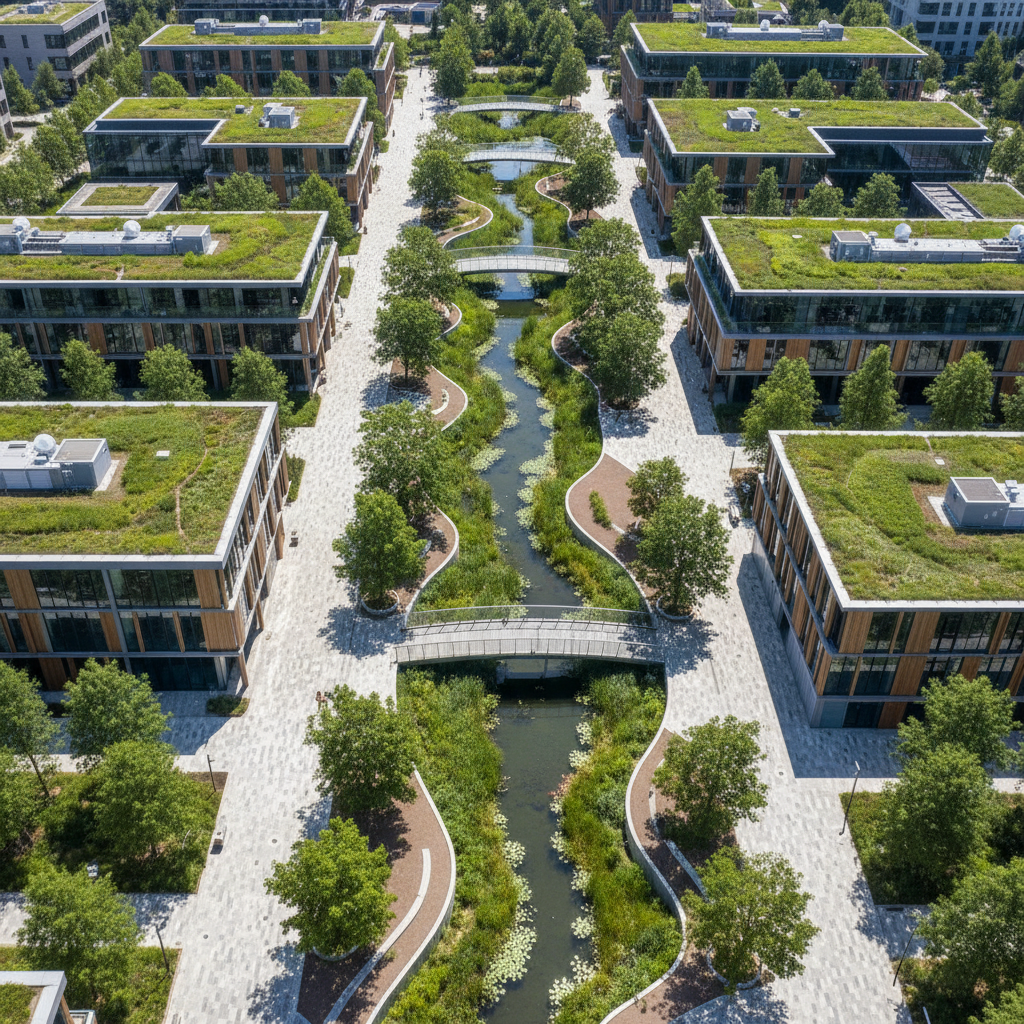
The UTCI (Universal Thermal Climate Index) measures the temperature as perceived by a pedestrian, taking into account not only air temperature but also solar radiation, wind, and humidity. Unlike land surface temperature (LST), which describes the thermal behavior of materials, the UTCI focuses on human comfort.
This approach is made possible by urban microclimate models that combine meteorological data (ERA5), land use, topography, and material properties to estimate the perceived temperature at a resolution of one meter.
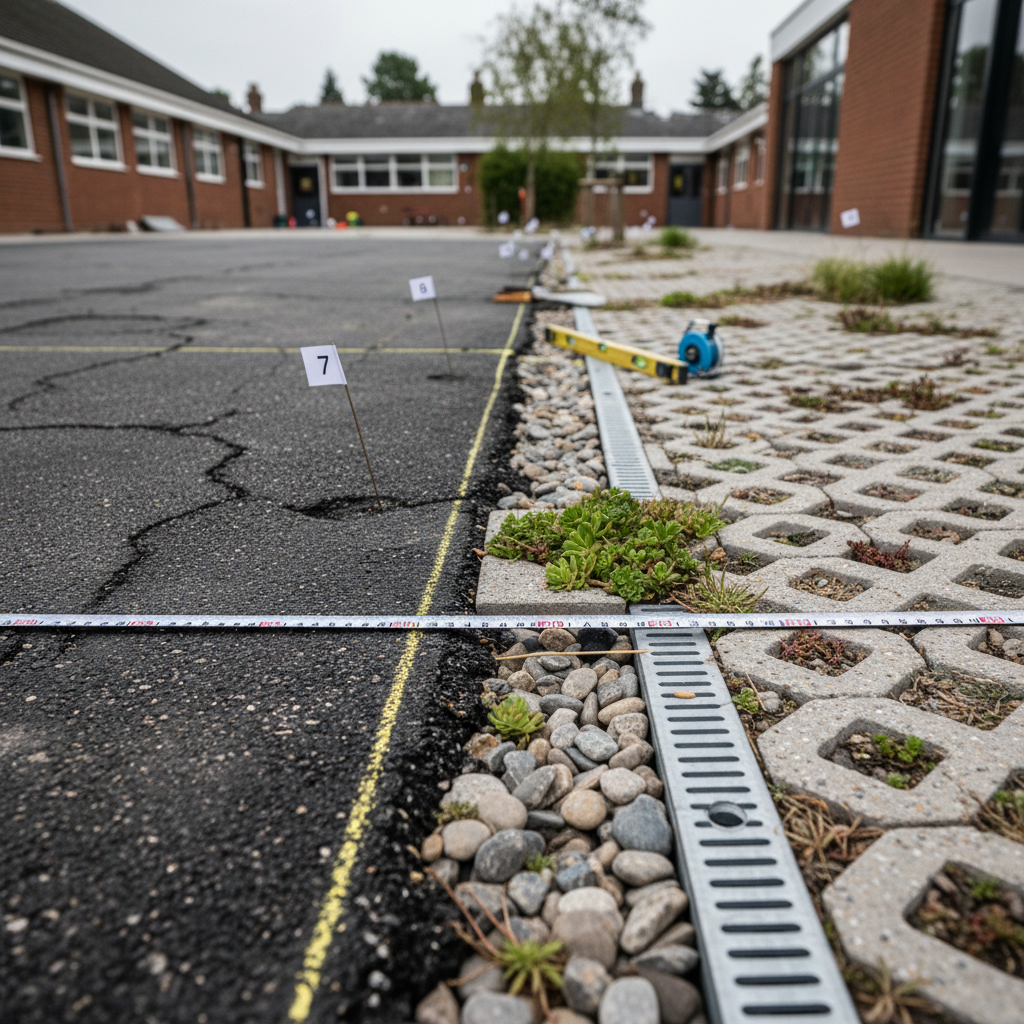
Under the ZAN Law (Zero Net Land Take), local authorities are required to halve their rate of land consumption by 2031, before achieving the goal of zero net land take by 2050. Detailed mapping of land use allows for the establishment of an objective baseline and the monitoring of changes over time as development projects proceed.
The Harmonized Biotope Coefficient by Area (CBSh) provides a comprehensive indicator of a site’s ecological quality. By combining habitat diversity, ecological connectivity, and the presence of living soils, it enables comparisons between different areas within a region and measures the impact of a restoration project on local biodiversity.
In the Bougainville Park project in Marseille (2.1 hectares), optimizing the plant selection yielded measurable results: a 10°C reduction in the perceived temperature (UTCI), an increase of 286.3 tCO2 in carbon sequestration, and 1.3 hectares of unpaved surface area.
In Antibes, the Combes project (2.6 hectares) illustrates the entire process: assessment of the initial condition, simulation of the project’s impact, optimization of the plant selection in collaboration with the landscape architect, and support through the process of obtaining the Low-Carbon Tree-Lined City Label. Result: a 5.5°C reduction in perceived temperature and an additional 52.3 tCO2 of carbon sequestration.
The real challenge for the coming terms of office will not only be to take action, but to demonstrate its impact. The communities that are able to structure their climate strategies around objective, traceable, and comparable indicators over time will be the ones that secure funding, rally their residents, and produce sustainable results.
Netcarbon provides local governments with an environmental assessment and simulation platform that covers the entire territory based on four key indicators: carbon sequestration, urban heat islands (UTCI), land cover change, and biodiversity (CBSh). Each project can be simulated in advance, each result tracked over time, and the data generated directly feeds into PCAET assessments, sustainability reports, and funding applications.
Climate transition cannot be imposed by decree. It must be measured.

.png)
.png)
.png)
.png)