Combating UCCs: How Local Governments Can Measure and Demonstrate Their Impact

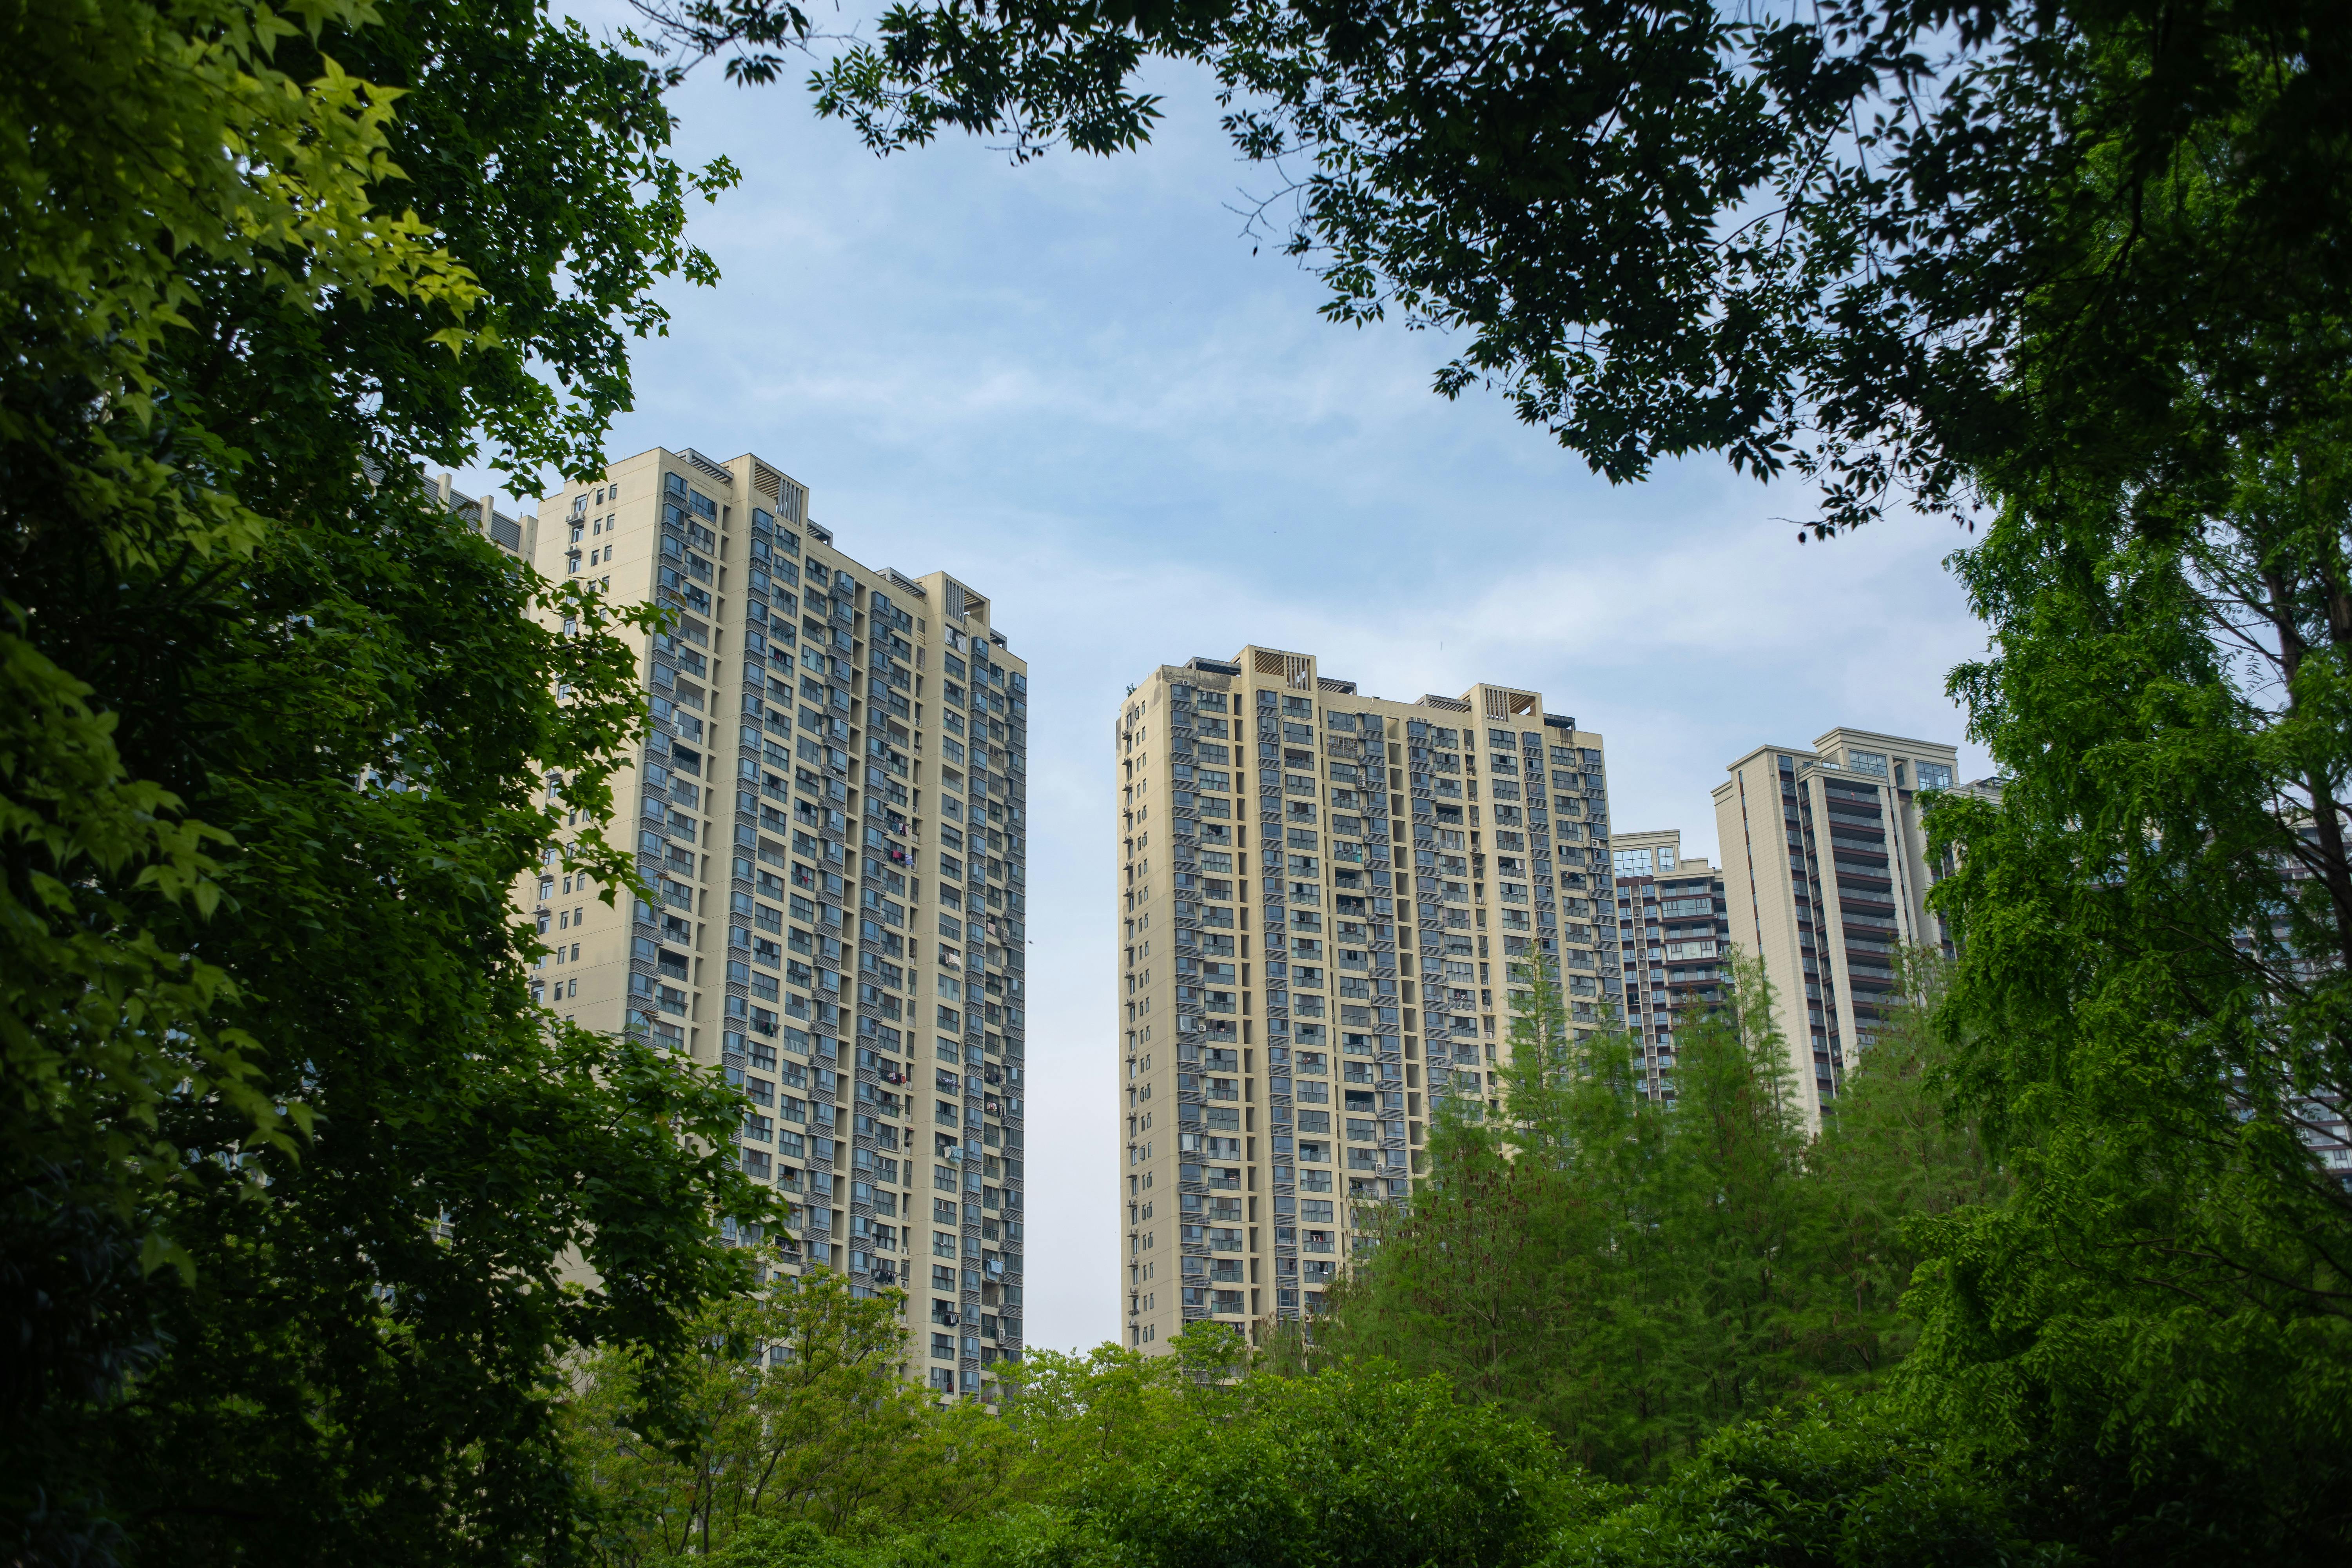
Vue aérienne d'un quartier d'une mégalopole française
27/10/2025
Contents
Do you have any questions?
Contact us

Combating UCCs: How Local Governments Can Measure and Demonstrate Their Impact

Cities are increasingly committed to combating the urban heat island effect. From urban tree-planting initiatives to the restoration of public spaces and the removal of impervious surfaces from school playgrounds, such initiatives are on the rise. But there is often a gap between announcements and evidence of impact. How can we objectively measure whether the trees that have been planted have actually lowered temperatures?


A regulatory environment that requires measurement

The PCAET (Territorial Climate, Air, and Energy Plan)

Mandatory for public intermunicipal cooperation bodies (EPCI) with more than 20,000 residents, the PCAET must include a section on climate change adaptation that covers the management of critical infrastructure. However, the regulations do not specify a particular measurement method, leaving local authorities to grapple with a methodological challenge.

The Climate and Resilience Act (2021)

It strengthens the requirements for incorporating climate risk into urban planning documents (local urban planning schemes, territorial coherence plans) and requires large local authorities to conduct vulnerability assessments.

National and European calls for proposals

Access to funding (ERDF funds, ADEME calls for proposals) is increasingly contingent on the provision of measurable and verifiable data on the environmental impact of projects.

The ZAN Law (Zero Net Land Development)

It requires local governments to monitor and reduce land sealing. Renaturation, the primary tool for combating urban sprawl, is directly linked to this objective.


The problem with traditional measurement methods

  • Weather sensors provide point measurements: they report the temperature at a specific location, not the detailed spatial distribution of air quality at the neighborhood level.
  • Satellite images of surface temperature (LST) often have limited resolution (10 to 100 meters) and measure only the ground temperature, not the temperature as felt by residents.
  • Les données sont difficiles à comparer dans le temps car les conditions météo varient d'une année à l'autre.

A new approach: the UTCI territorial assessment

The method developed by Netcarbon produces a comprehensive map of the UTCI across the entire region, at a resolution of 1 meter, updated hourly.

This approach makes it possible to:

  • Map all high-risk areas throughout the municipality or regional authority
  • Prioritize interventions: identify where an investment in greening will have the greatest thermal impact
  • Simulate before deciding: test several scenarios and choose the one that offers the best cost-to-impact ratio
  • Measure after implementation: have quantifiable evidence of the impact achieved

Incorporate the UTCI into the PCAET and calls for proposals

In the PCAET

  • Monitoring indicator: Year-over-year change in the area of the territory experiencing high or extreme heat stress (UTCI > 32°C or > 38°C)
  • Thermal vulnerability map to be incorporated into the regional assessment
  • Quantitative targets for reducing ICU admissions in priority areas

In the funding applications

  • Quantification of the expected impact (reduction in UIC, unsealed areas, tCO2 stored)
  • Before-and-after maps to support grant applications
  • Indicators verifiable by third parties (transparent methodology, public source data from ERA5 and IGN)

In public communication

  • Dashboards accessible to elected officials and citizens
  • Monitoring the progress of Canopy Plans or restoration plans
  • Demonstrating the value of initiatives using concrete data

The special case of school playgrounds

School playgrounds are among the areas most vulnerable to urban heat islands: large impervious surfaces, lack of shade, and heavy use by children. UTCI simulation helps maximize the effectiveness of investments in these areas: where should trees be planted? Which surfaces should be prioritized for de-impermeabilization? What type of paving should be used in areas without vegetation?


Toward a Shared Territorial Framework

By conducting the assessment annually on the same reference date (August 15 in the Netcarbon method), elected officials gain access to an objective trend line showing the thermal performance of their region—a climate management tool that is up to the challenge.


Does your municipality want to map its heat islands, prioritize its restoration efforts, and access data for your Climate Action Plans (PCAET) and funding applications? Find out how Netcarbon supports cities and regional authorities.

Nos articles

Règle 3-30-300 : la nouvelle référence européenne pour évaluer la végétalisation des villes

Marché du carbone territorial : mythe ou levier réel pour les collectivités ?

Comment créer un îlot de fraîcheur en ville : guide méthodologique pour les collectivités

Cookie policyPrivacy policy