Netcarbon lets you precisely map your sites, model the impact of your development or renaturation projects, and enhance their environmental benefits.
Request a demo
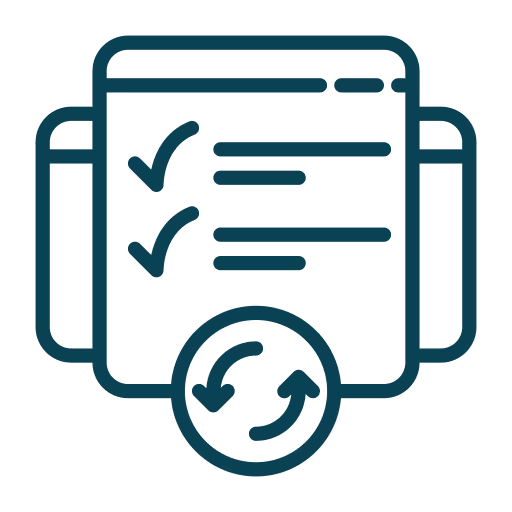
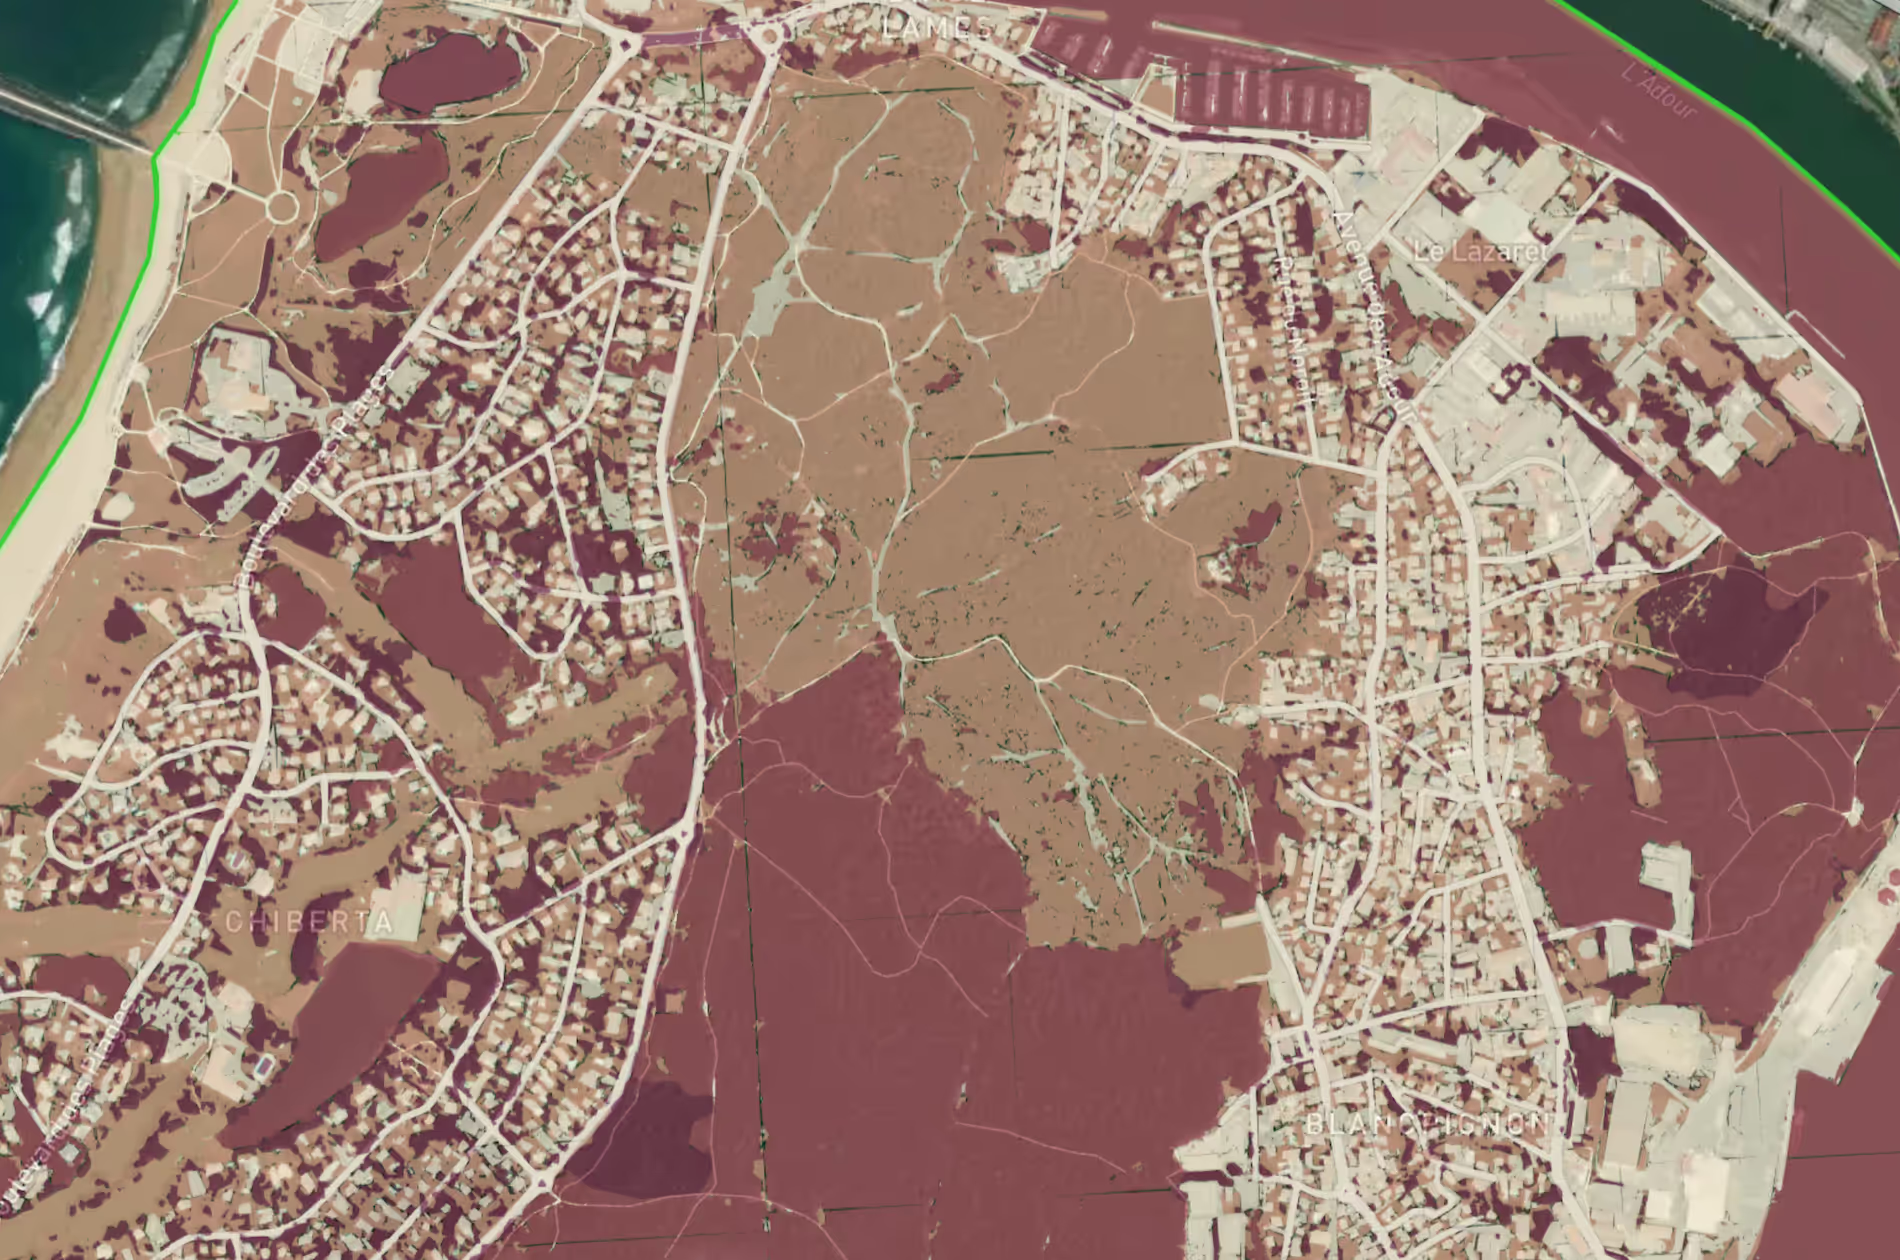
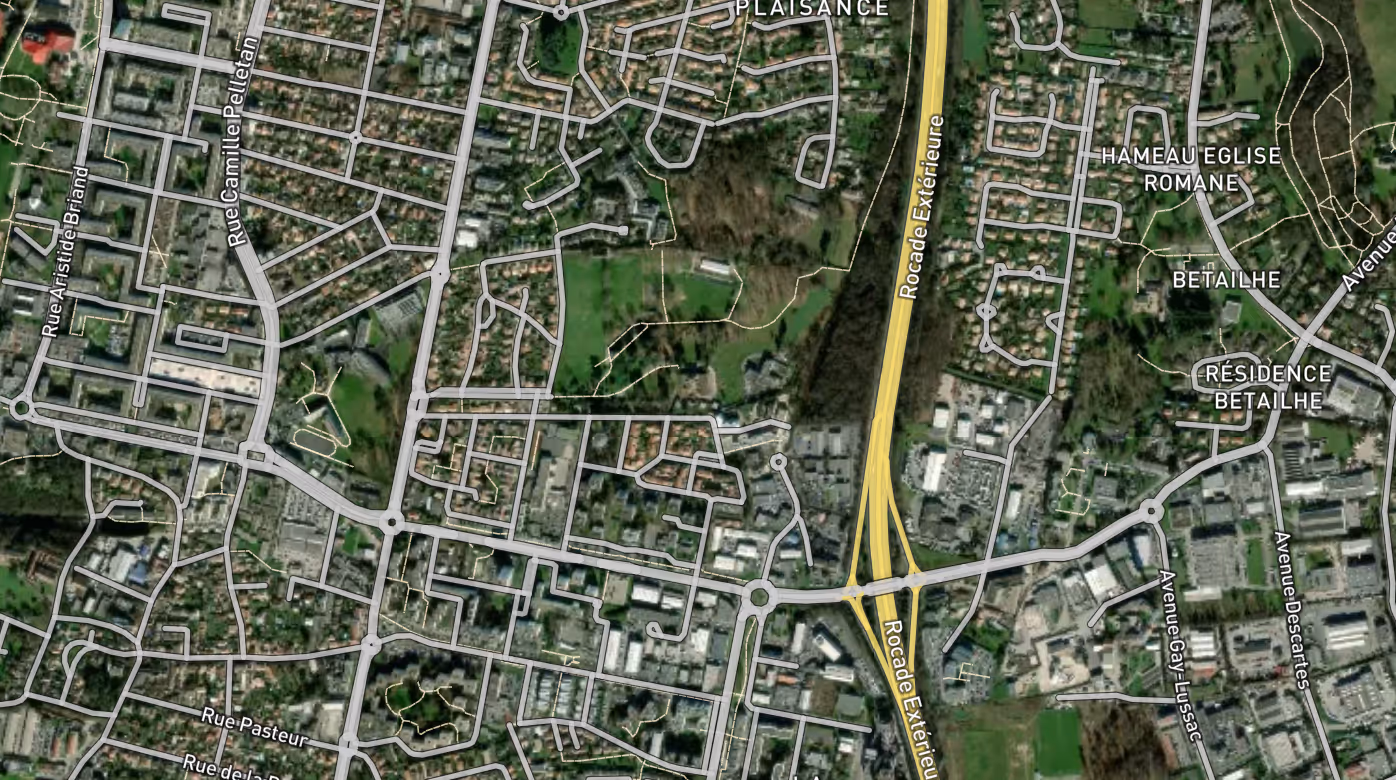
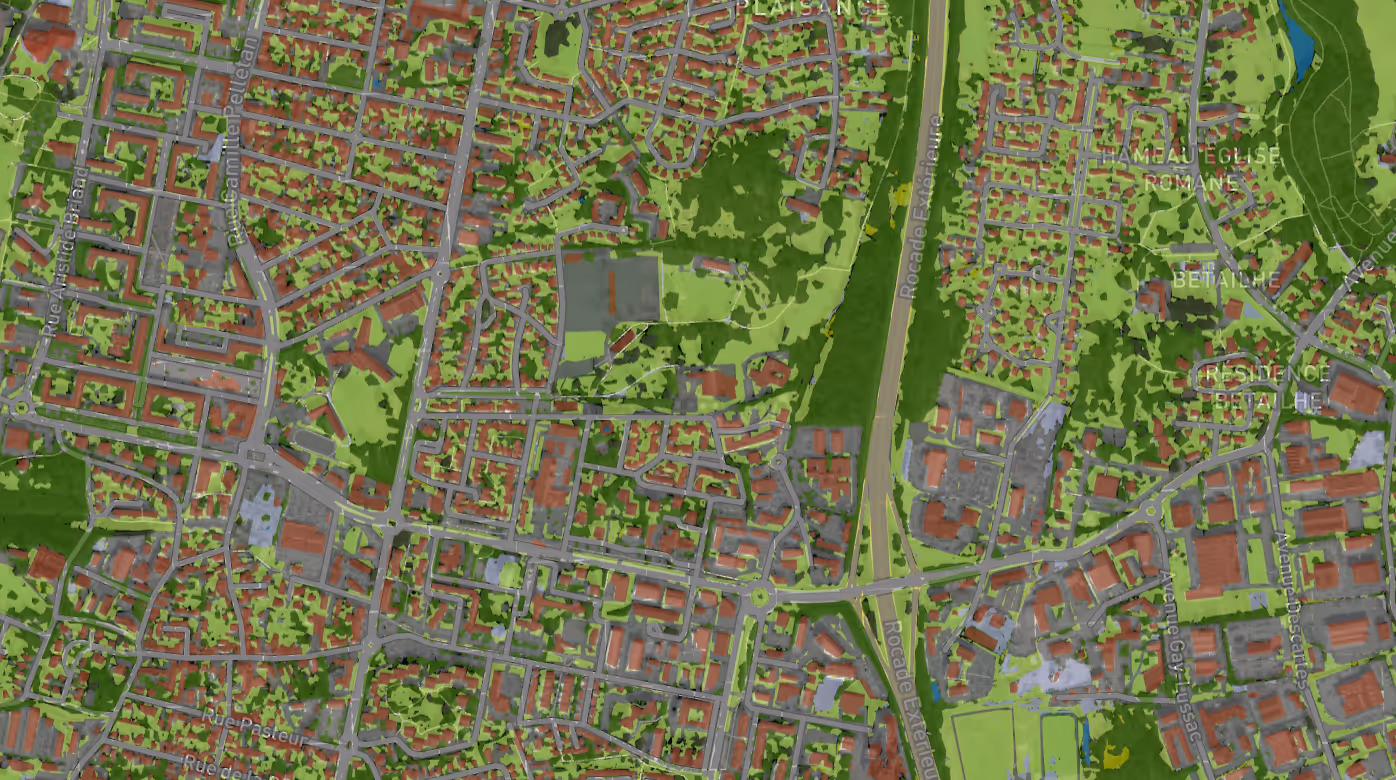
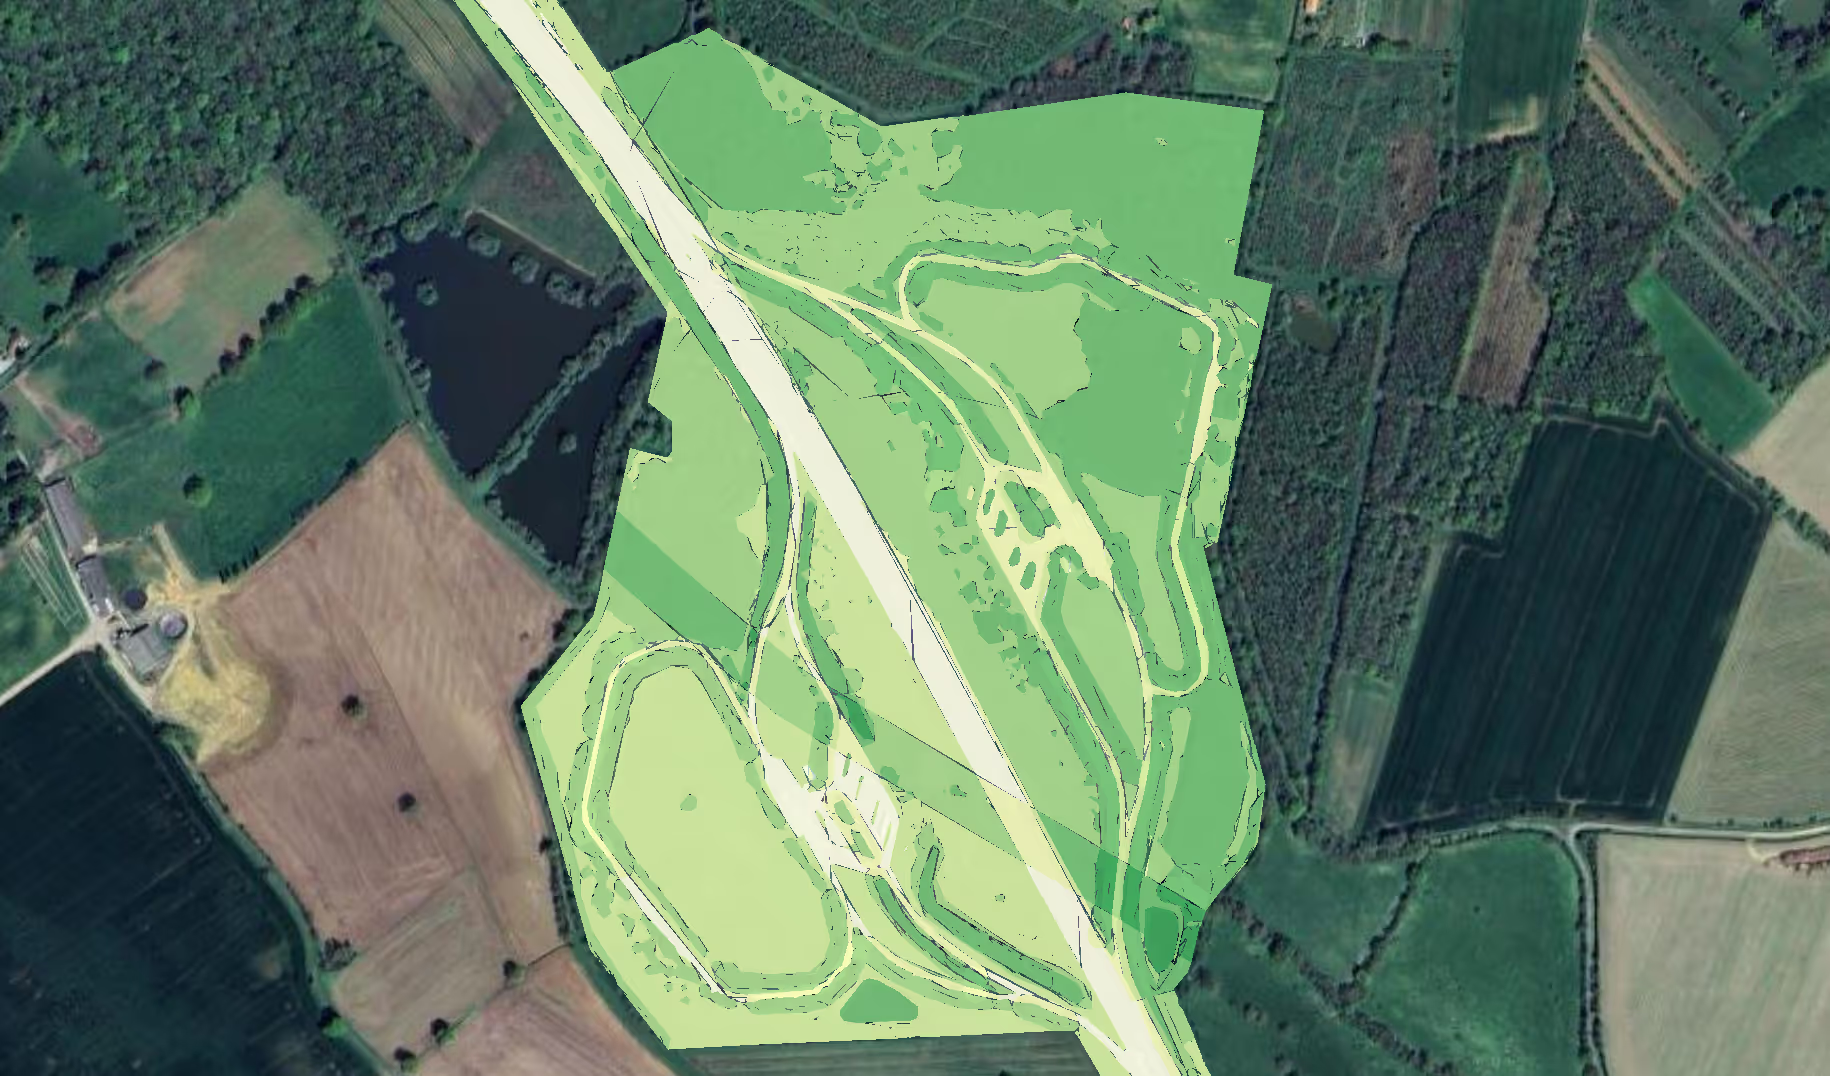
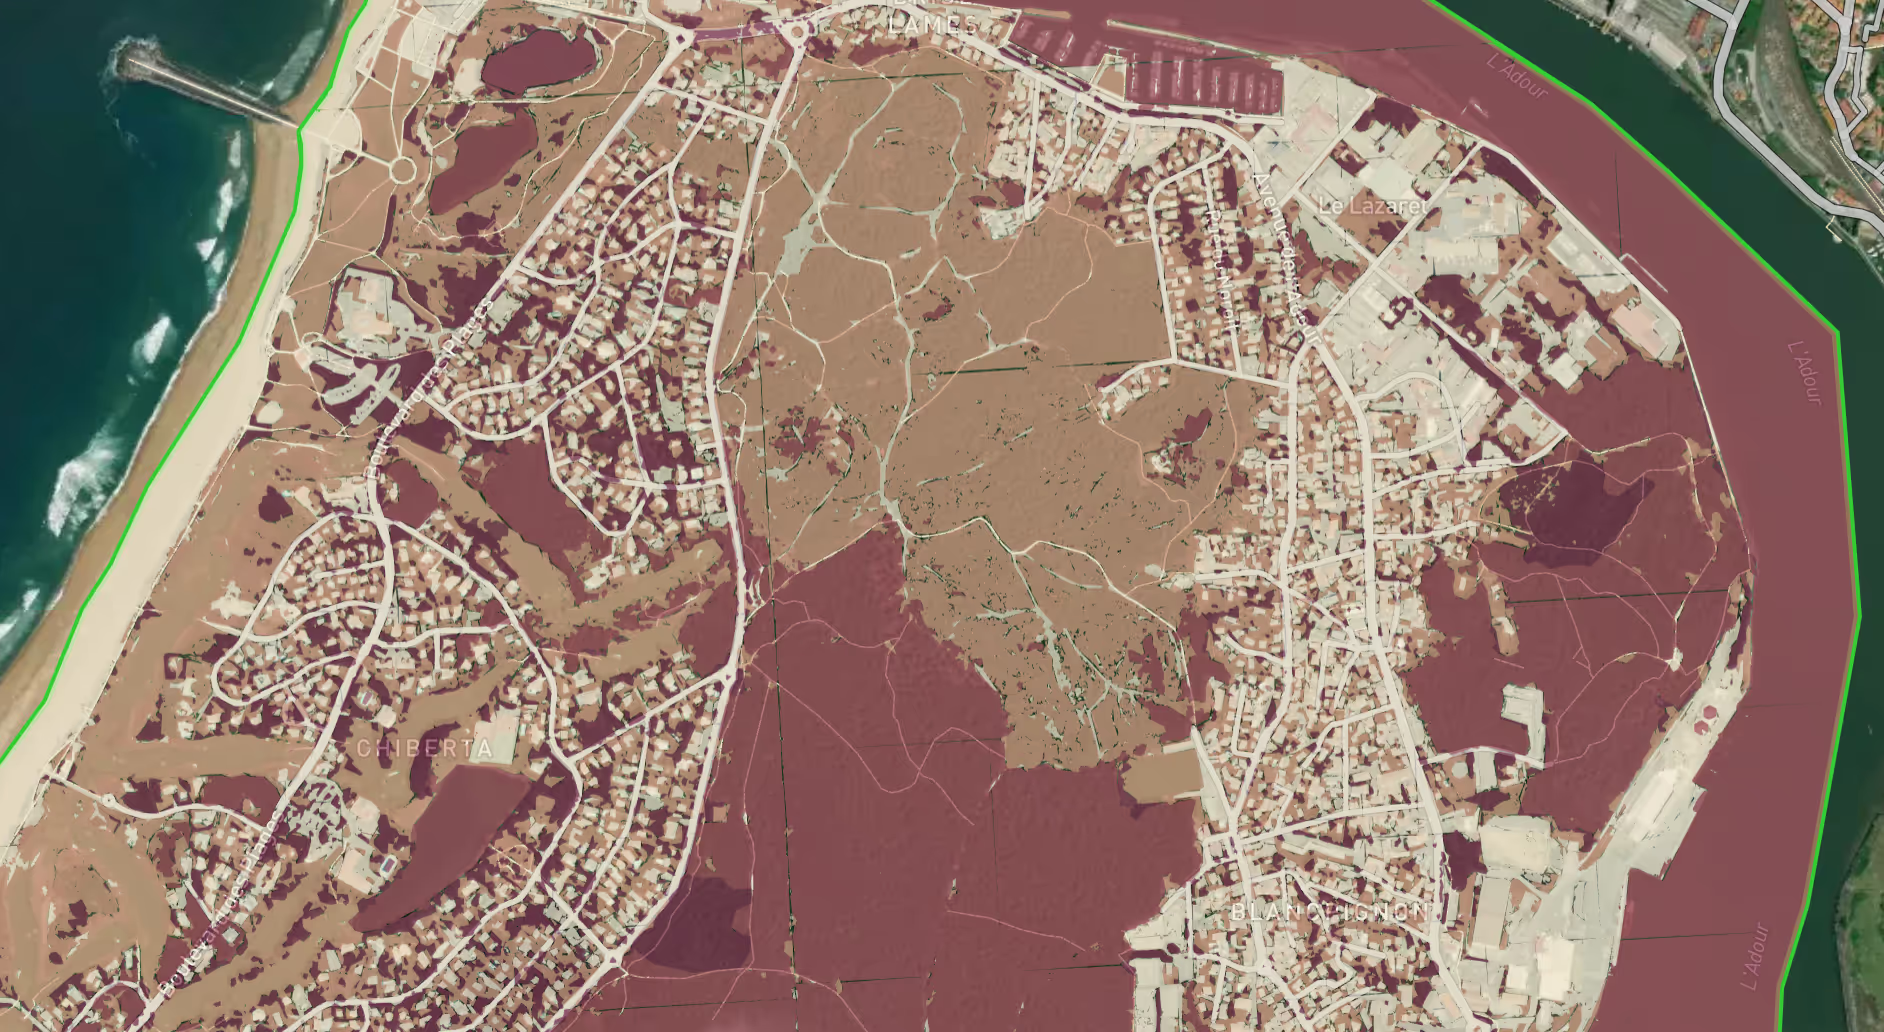
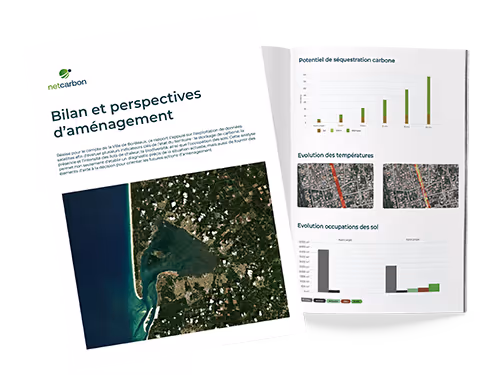
Analyze land use in detail and identify the dynamics of change in occupation on the scale of a site or territory
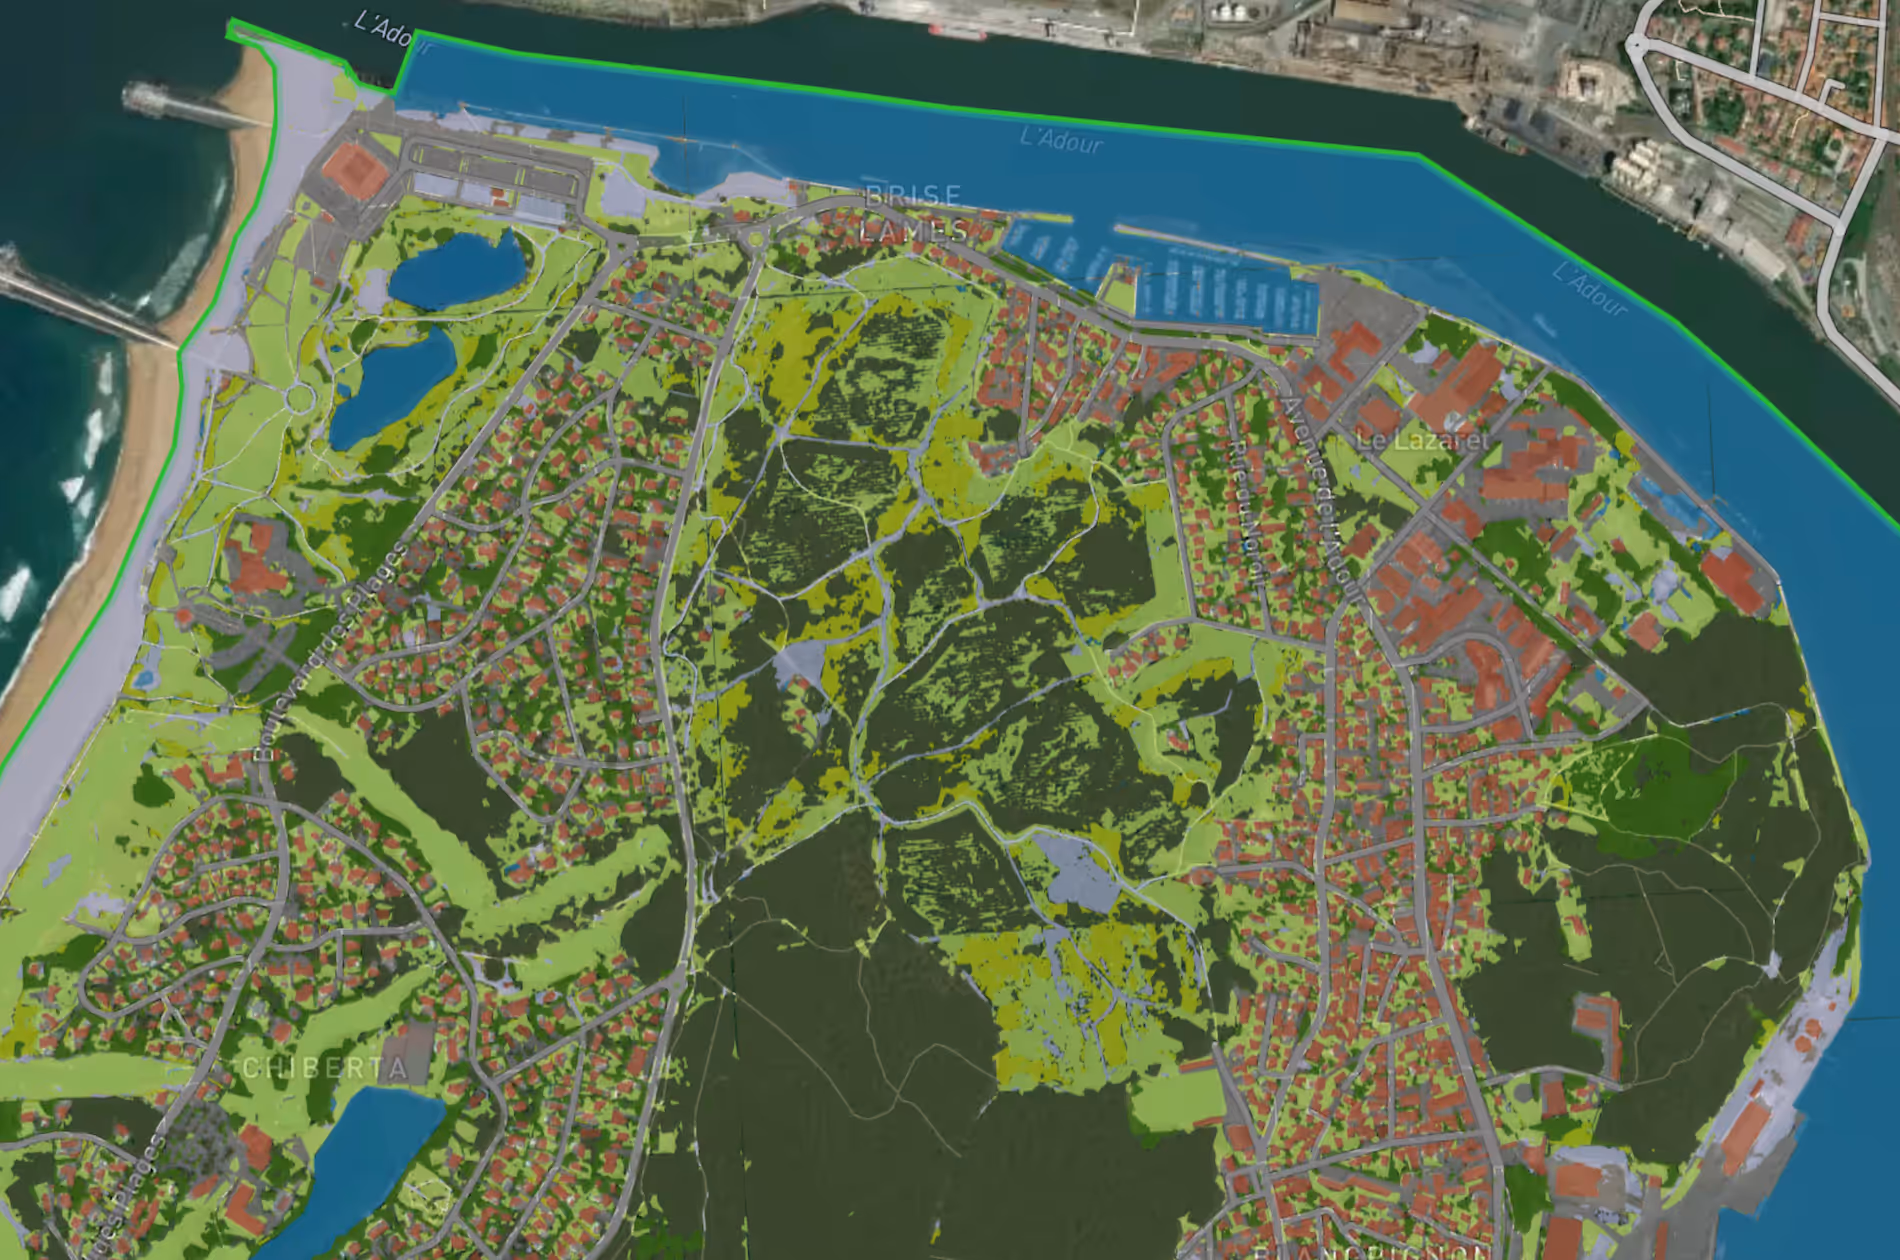
➔ Monitor changes in vegetated/artificialized surfaces
➔ Green grid analysis and identification of breaks in ecological continuity
➔ Monitor renaturation actions

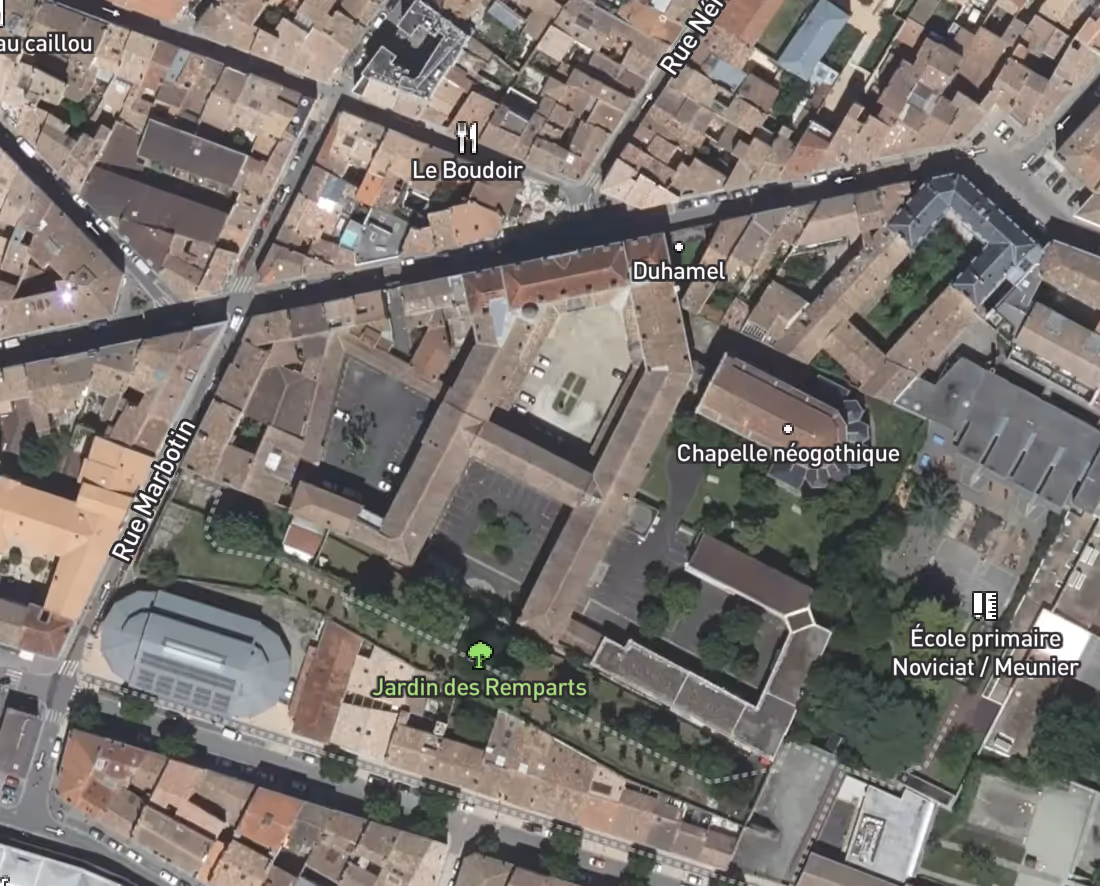
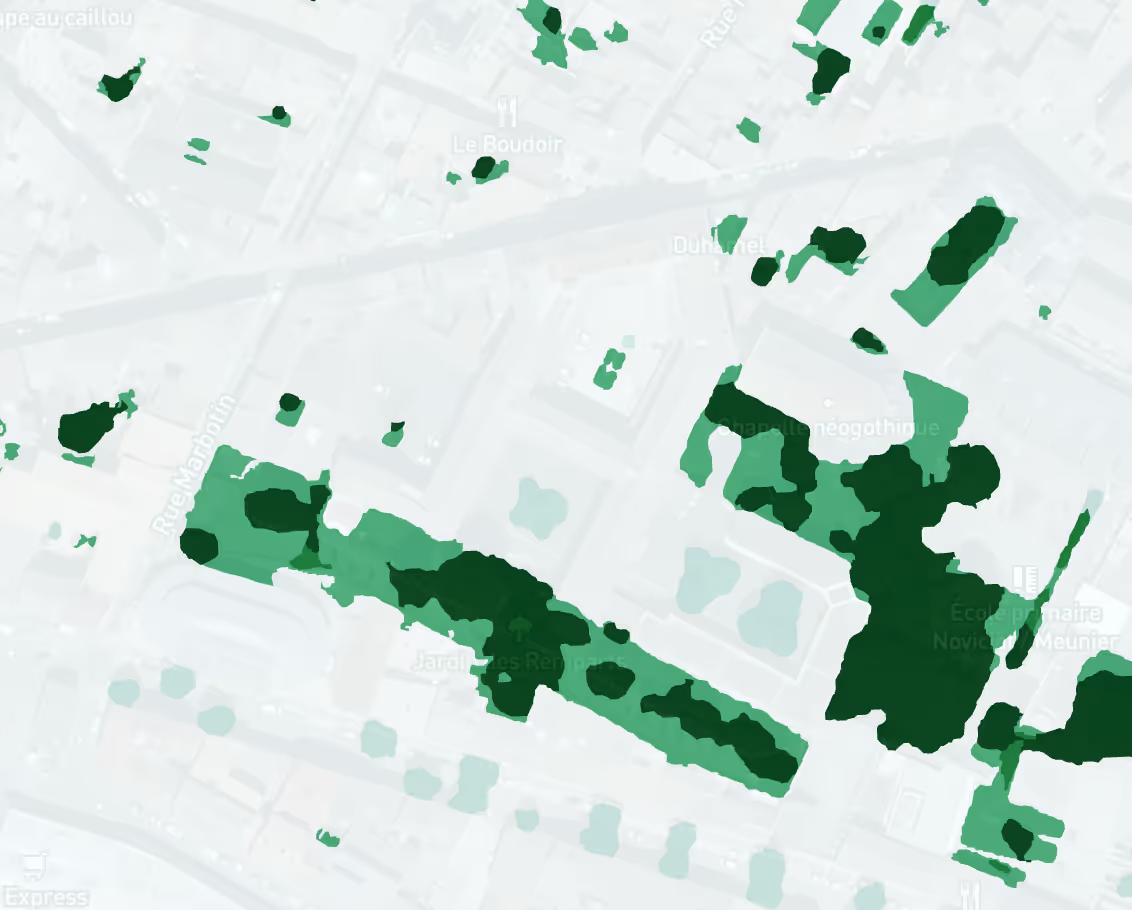
Scoring Foncier
Cross-reference multiple data sources (Land use, Wetlands, ZNIEFF, Natura 2000, Hedgerows, Environmental measures...) to assign a Biodiversity Score to each parcel of your land.
➔ Track changes in Biodiversity Score over time
➔ Prioritize development / renaturation actions.
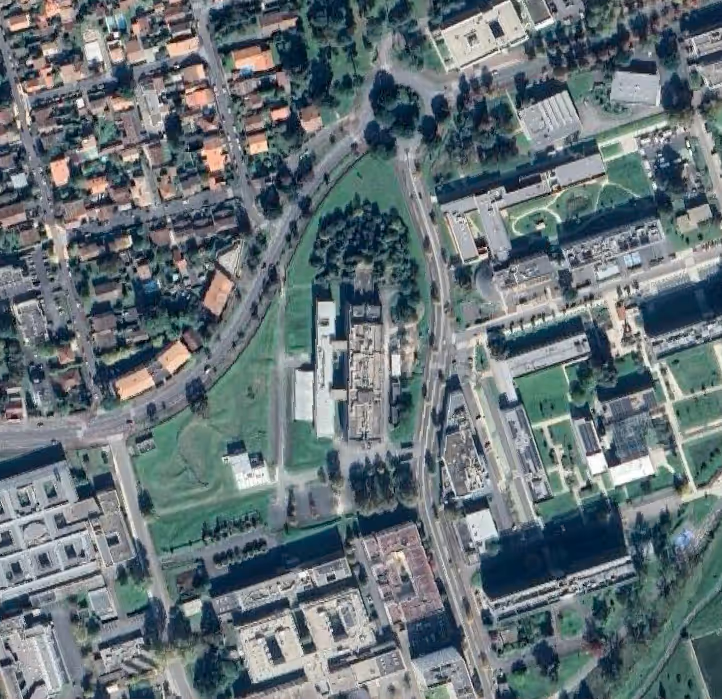
Surface Biotope Coefficient
Measure the proportion of spaces favorable to biodiversity and soil permeability in a development
➔ Design more sustainable developments, by systematically integrating vegetated and permeable surfaces.
➔ Facilitate comparison and monitoring of projects thanks to a homogeneous calculation method.
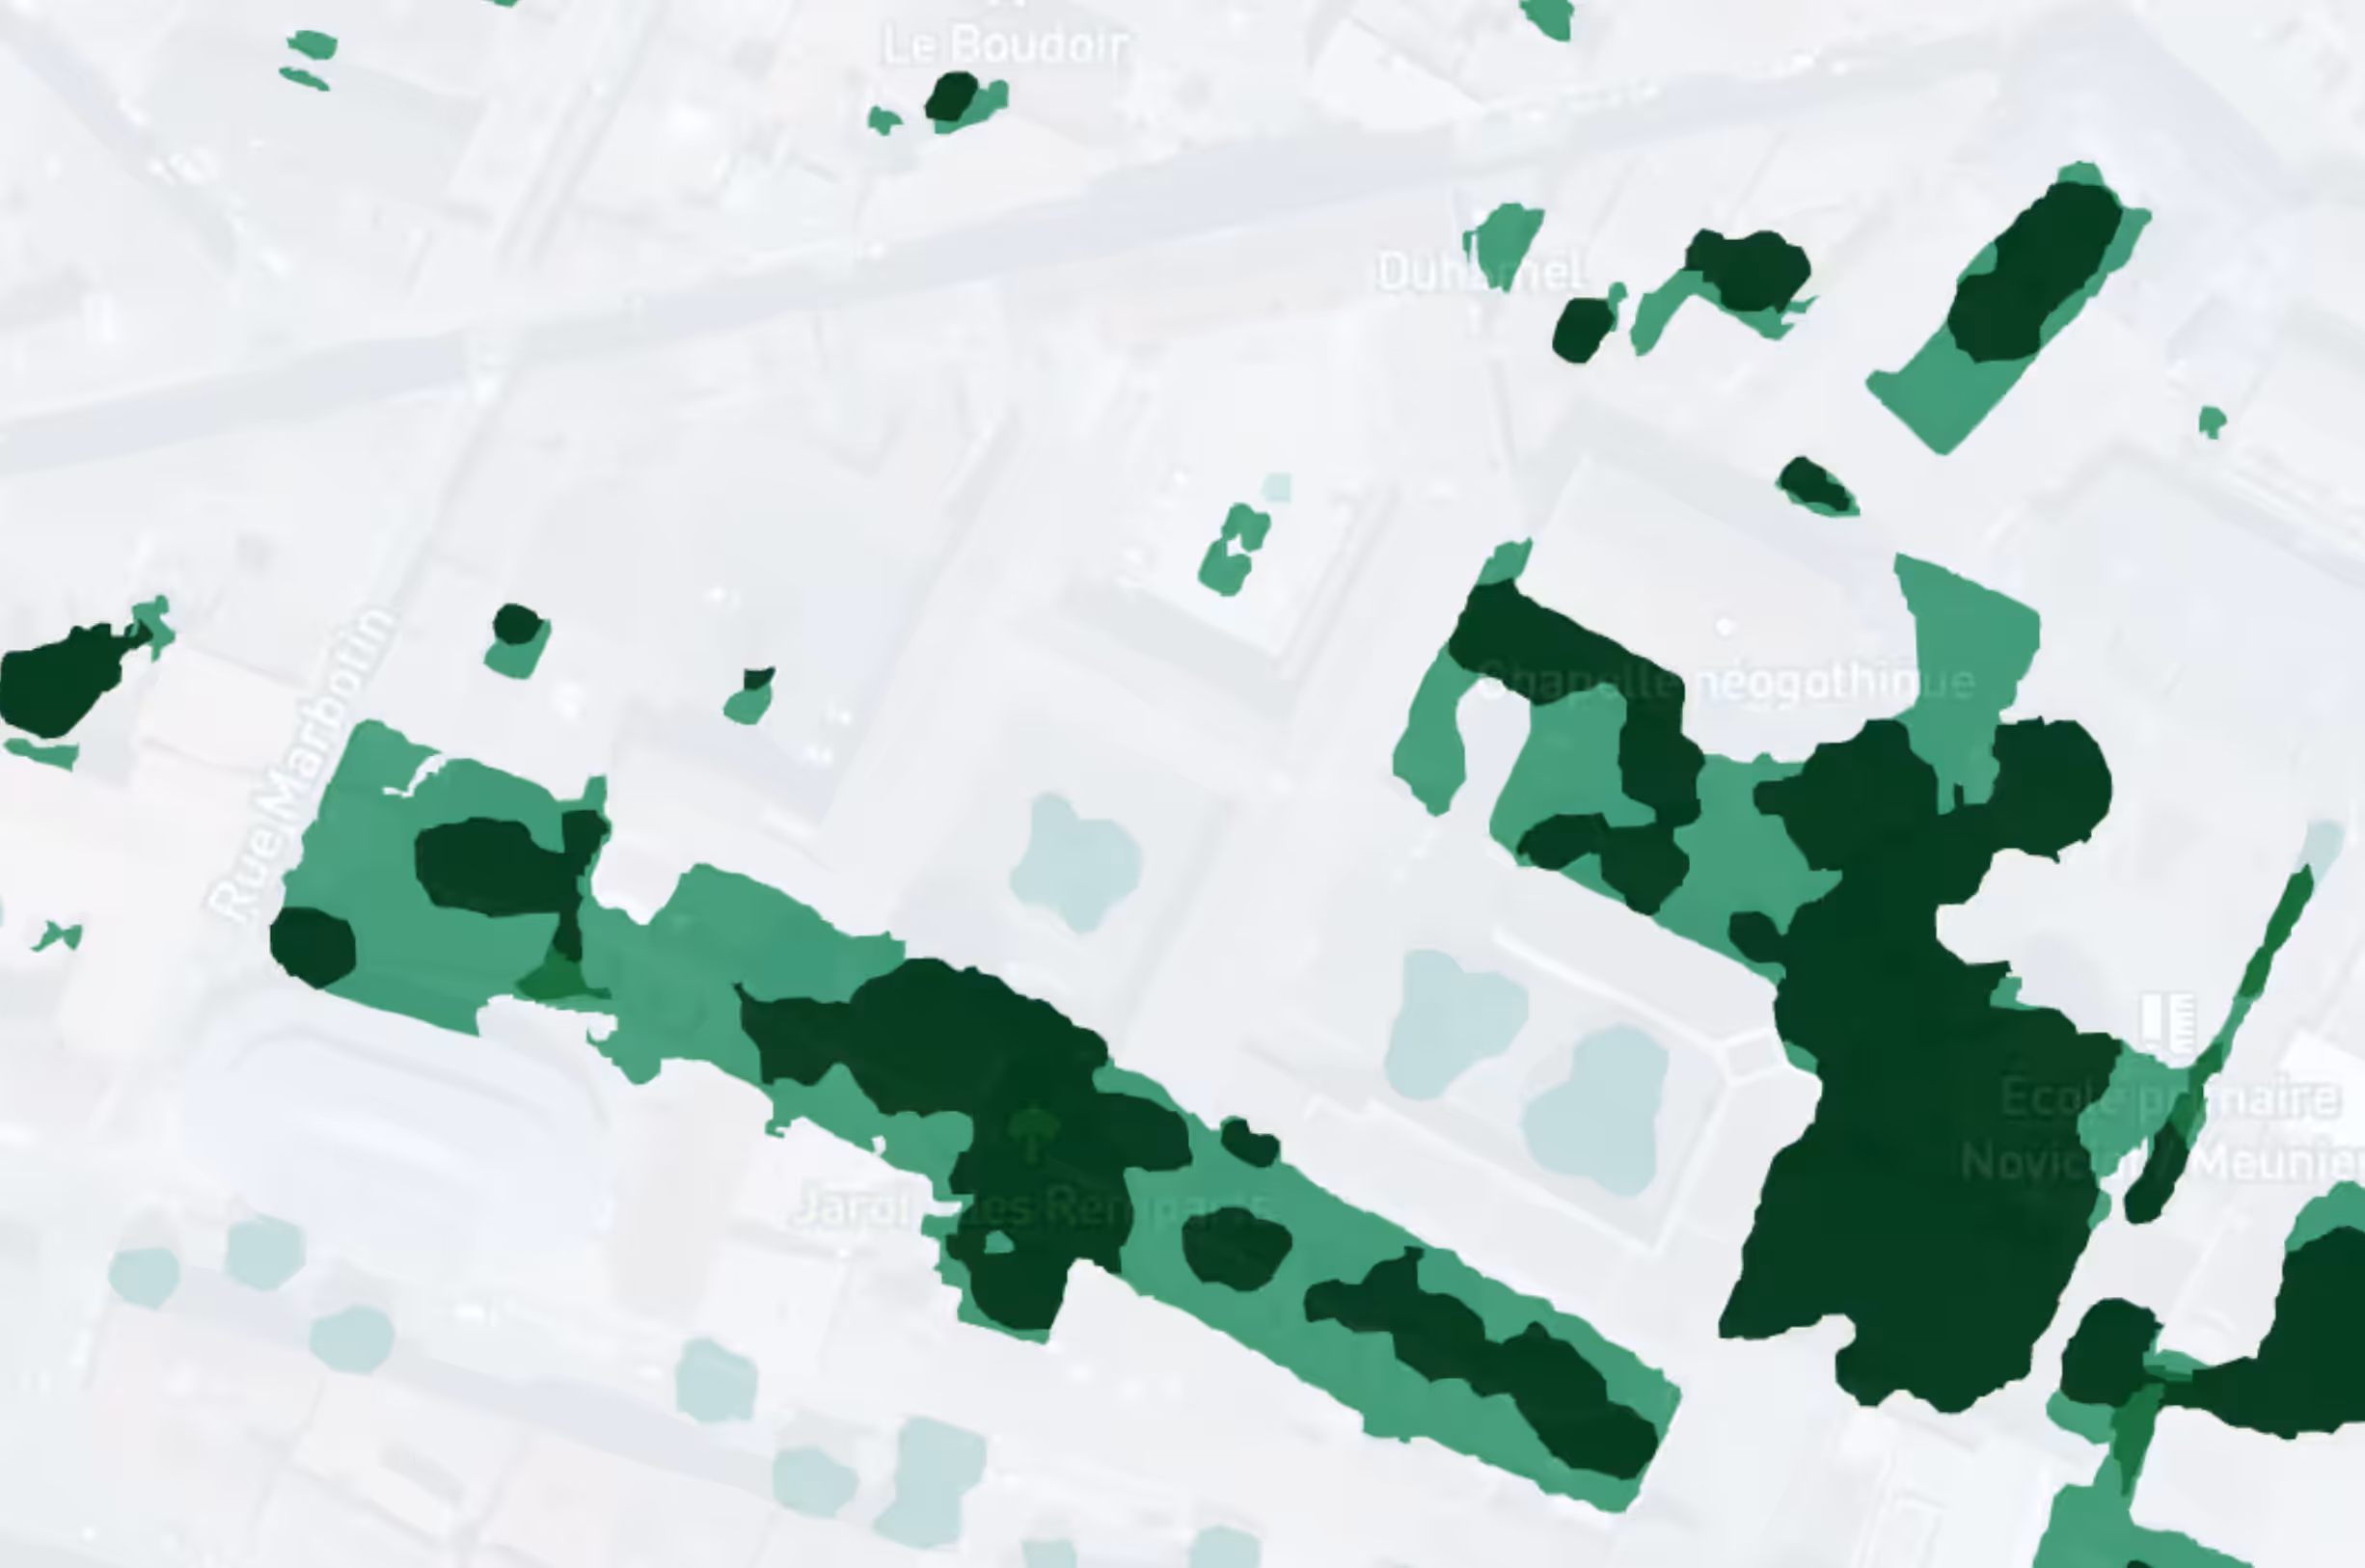
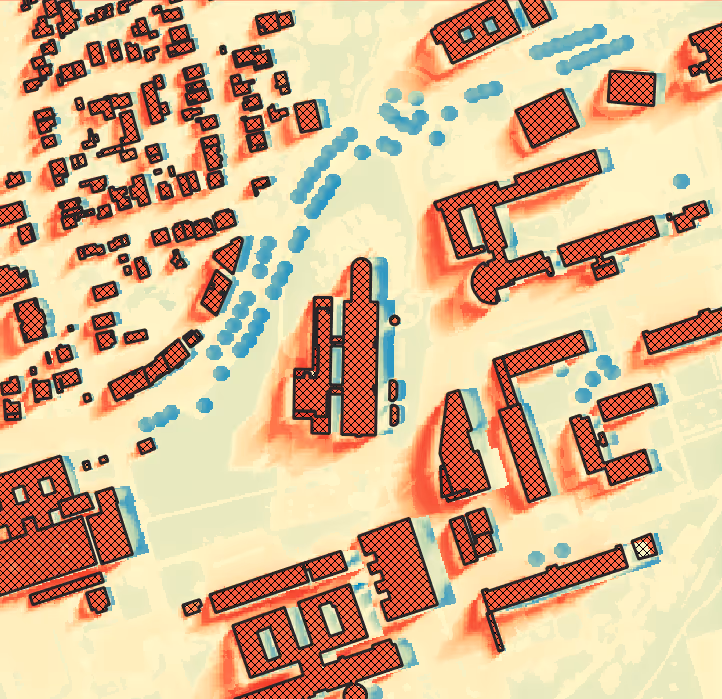
UTCI
The UTCI (Universal Thermal Climate Index) measures the human thermal experience outdoors by combining temperature, humidity, wind and solar radiation.
➔ Assess the impact of developments on users' thermal comfort.
➔ Guide design (vegetation, shading, materials) to improve the climatic resilience of spaces.

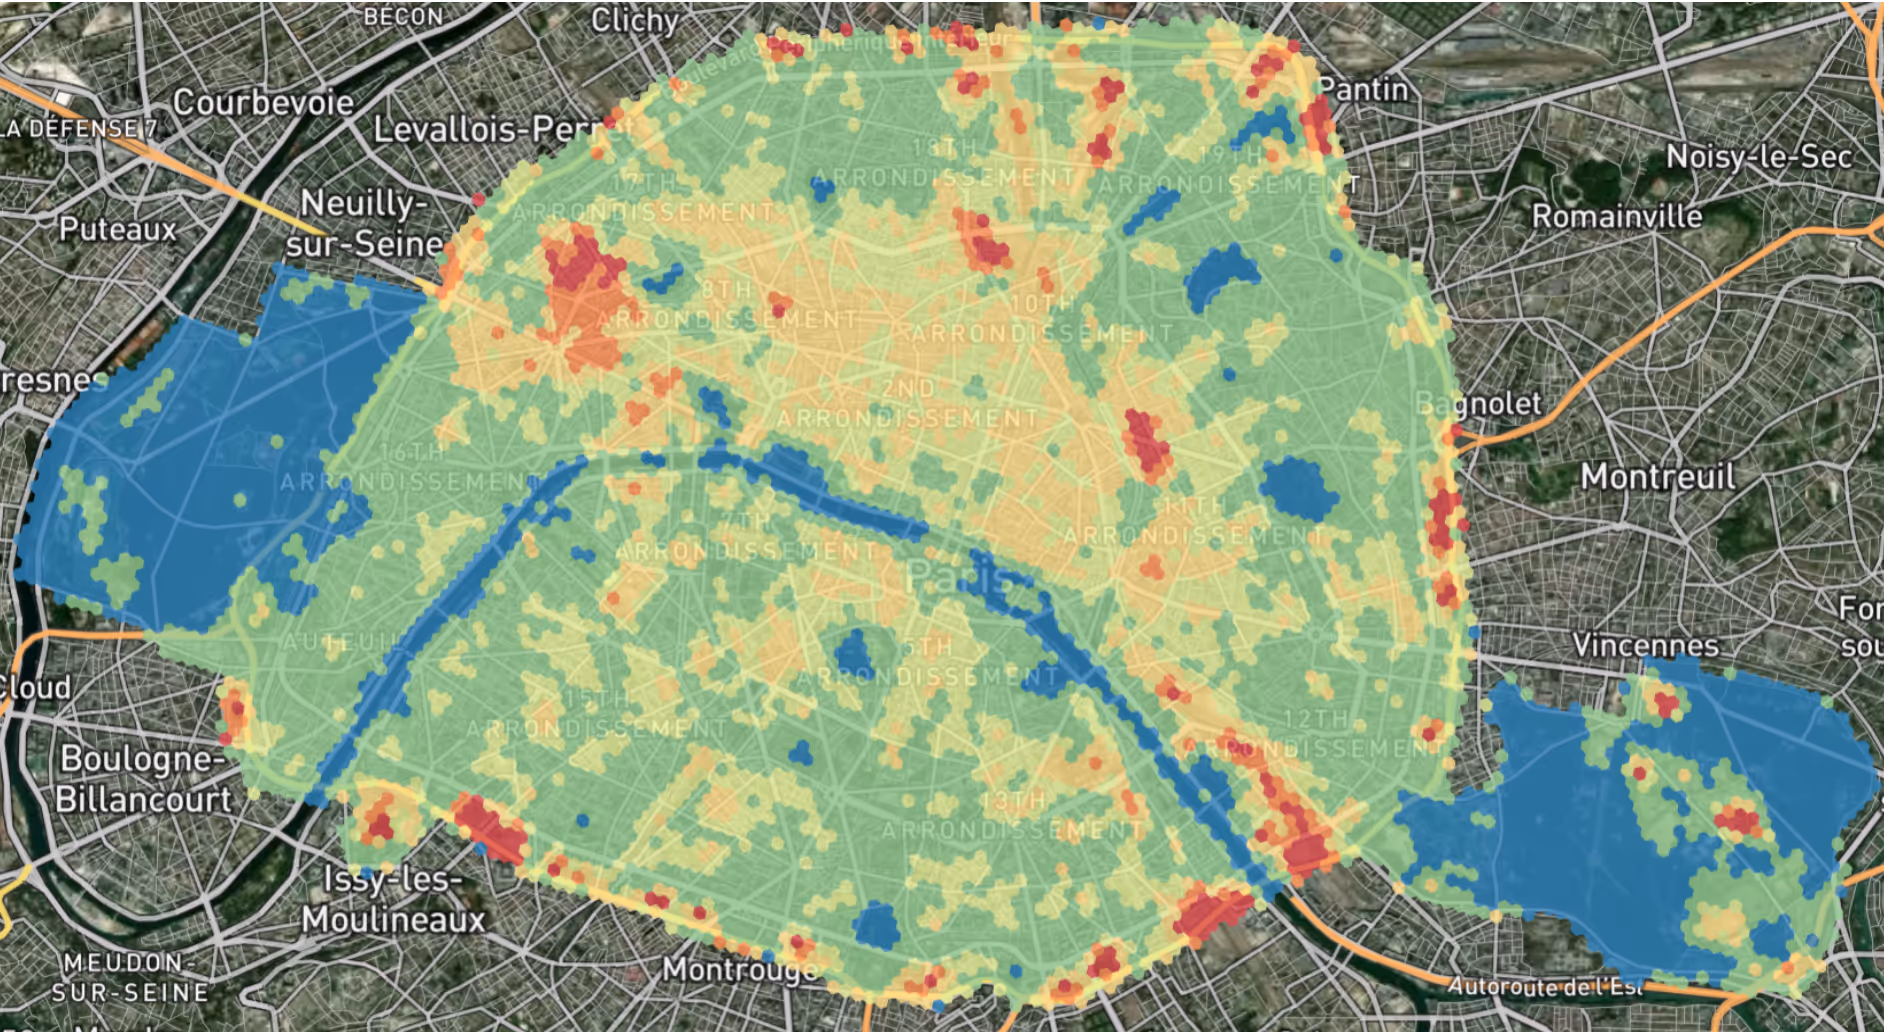
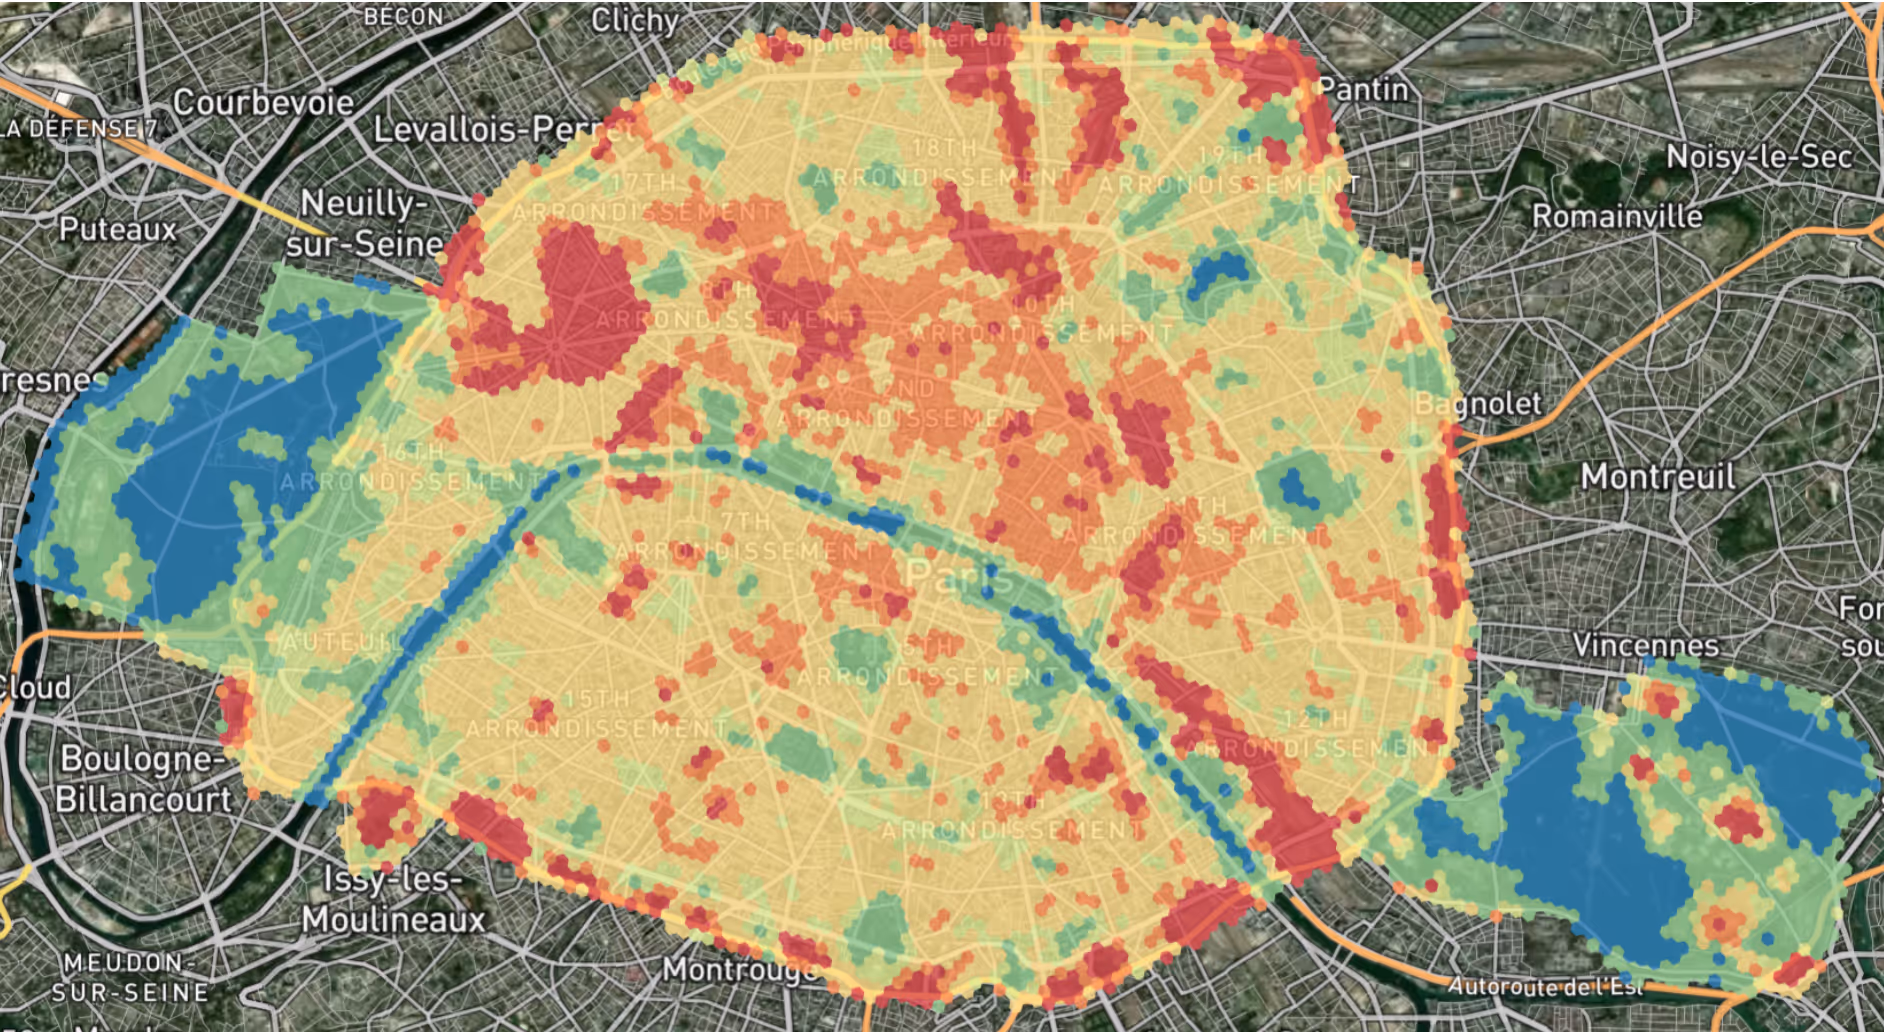
Project local temperature trends up to 2100 based on IPCC climate scenarios
➔ Anticipate the impact of long-term climate change.
➔ Test different development scenarios to choose the solutions best suited to future conditions.
Evaluate the quantity of carbon sequestered by a site and its evolution over time, thanks to the cross-analysis of satellite data, field data and scientific models.
➔ Precisely quantify the carbon impact of renaturation and revegetation actions.
➔ Valorize these results within the framework of certifications and carbon offset mechanisms.


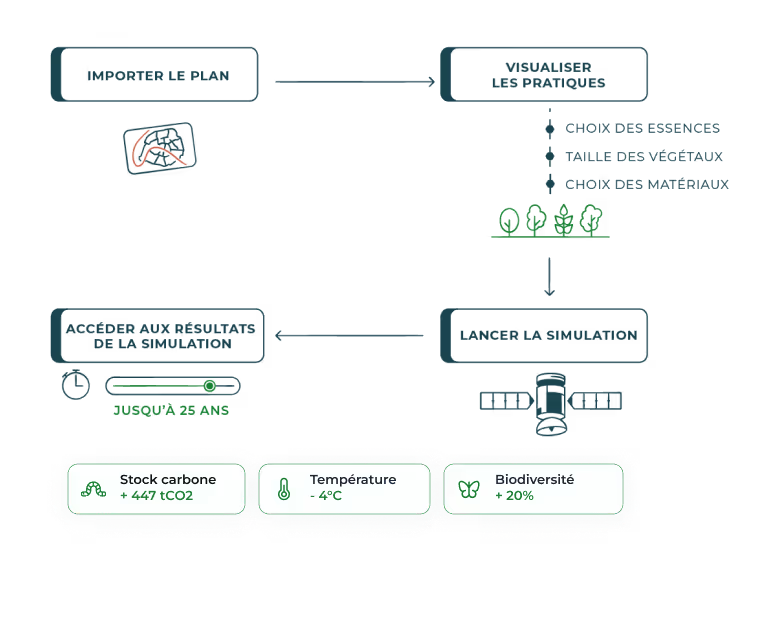
Step 1: Model directly in the application or import your plans (.dwg).
Step 2: Integrate plant characteristics (type, species, size) and materials (nature, color) to simulate environmental impact.
Step 3: View results and modify scenario to optimize impact
→ Track the evolution of your projects
Visualizethe impact of your projects over 5, 10, 15 or 25 years.Track the evolution of environmental indicators over time to steer your actions over the long term.
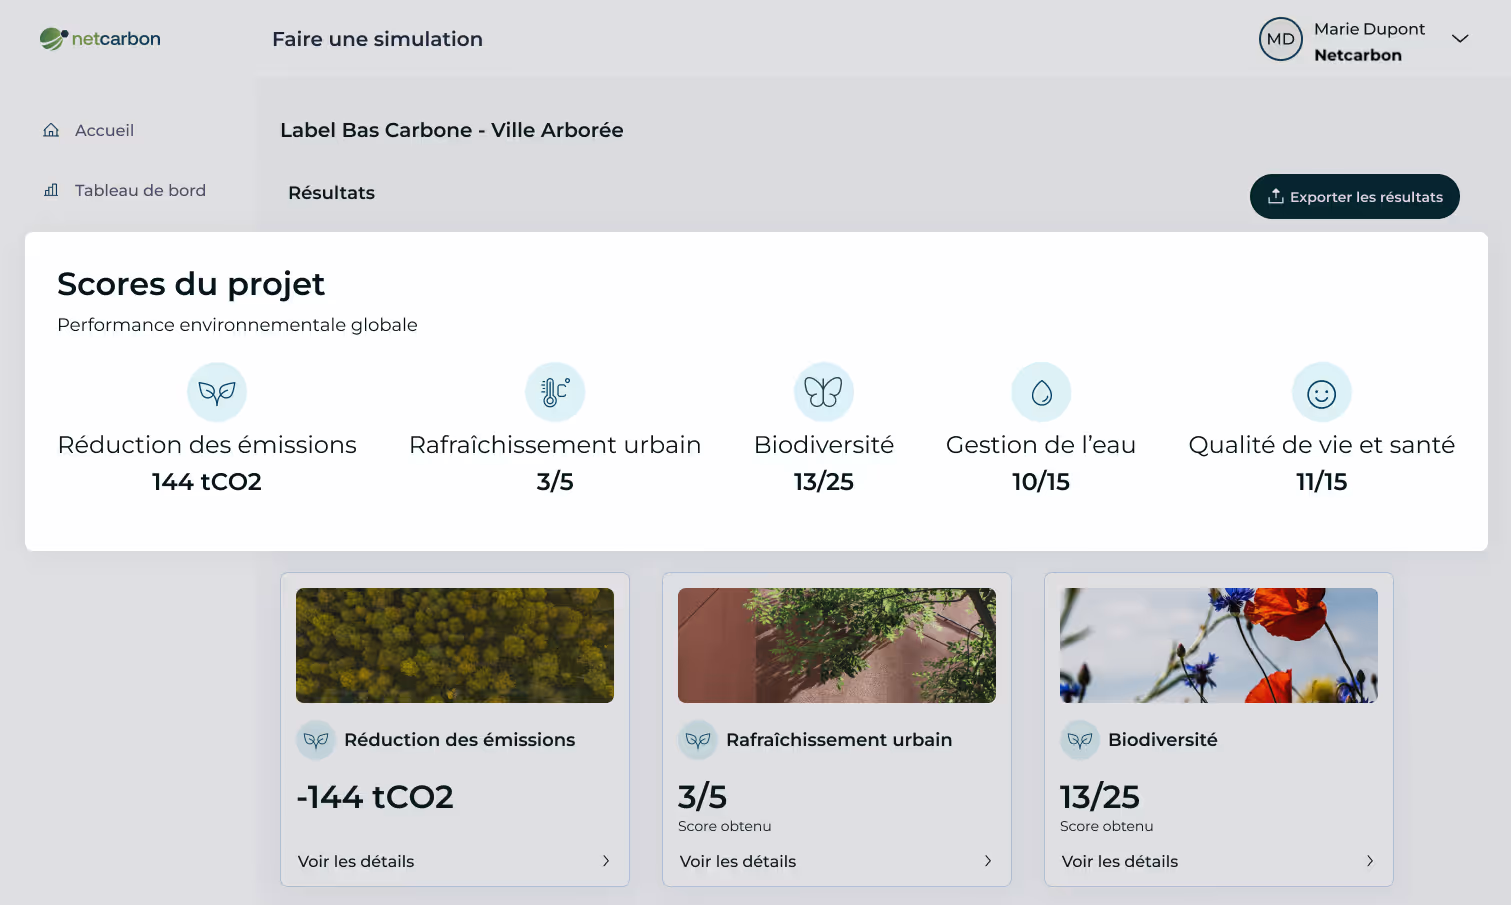
→Certify and promote your actions
Generatefiles that comply with official frameworks (Label Bas Carbone, etc.).Enhance the value of your projects in the eyes of your partners, funders and the general public, thanks to concrete, verifiable proof.
→ Suivre l’évolution de vos projets
Visualisez l’impact de vos projets à 5, 10, 15 ou 25 ans.
Suivez l’évolution des indicateurs environnementaux dans le temps pour piloter vos actions dans la durée.
→ Certifier et valoriser vos actions
Générez des dossiers conformes aux cadres officiels (Label Bas Carbone, GHG Protocol).
Valorisez vos projets auprès de vos partenaires, financeurs ou citoyens grâce à des preuves concrètes et vérifiables.
PLATFORM
Create your carbon capture strategy and track its impact over time
INTEGRATION
Visualize in real time your inventory of fixtures in your business tools (GIS) thanks to our APIs
.webp)