FREN Book a demoDemo →
SimulationÎlot des TanneursCarbon Stock+398 tCO₂perceived temperature−4.2 °C
The app Netcarbon

Understand, simulate, decide.

Accurately map your sites, model the impact of your development or restoration projects, and highlight their environmental benefits—all within a single application.

My Areas5Click on an area to view it
  • Tanners' IsletScenario B · 3 scenarios3.2 haSimulation
  • Les Tilleuls School ComplexSchoolyard · Initial Condition0.8 haAssessment
  • Les Charmes Residential ComplexLabel Bas Carbone (French low-carbon label)1.4 haCertified
  • Parc des BergesMonitored since 20182.1 haAssessment
  • North Park-and-Ridedepaving0.6 haSimulation
Workspace · Sample Areas and Data
The Course

Frombaseline assessment to certification

Four steps, one application: assessing your site, simulating your project, monitoring it over time, and leveraging the results.

01

baseline assessment ingYour Area

Get an accurate map of your sites based on key indicators: vegetation, land cover, heat islands, biodiversity, and carbon. Identify sensitive areas and prioritize your actions.

  • Seven indicators calculated on the same map
  • BD Ortho 's History Since 2018
  • Identified Sensitive Sectors
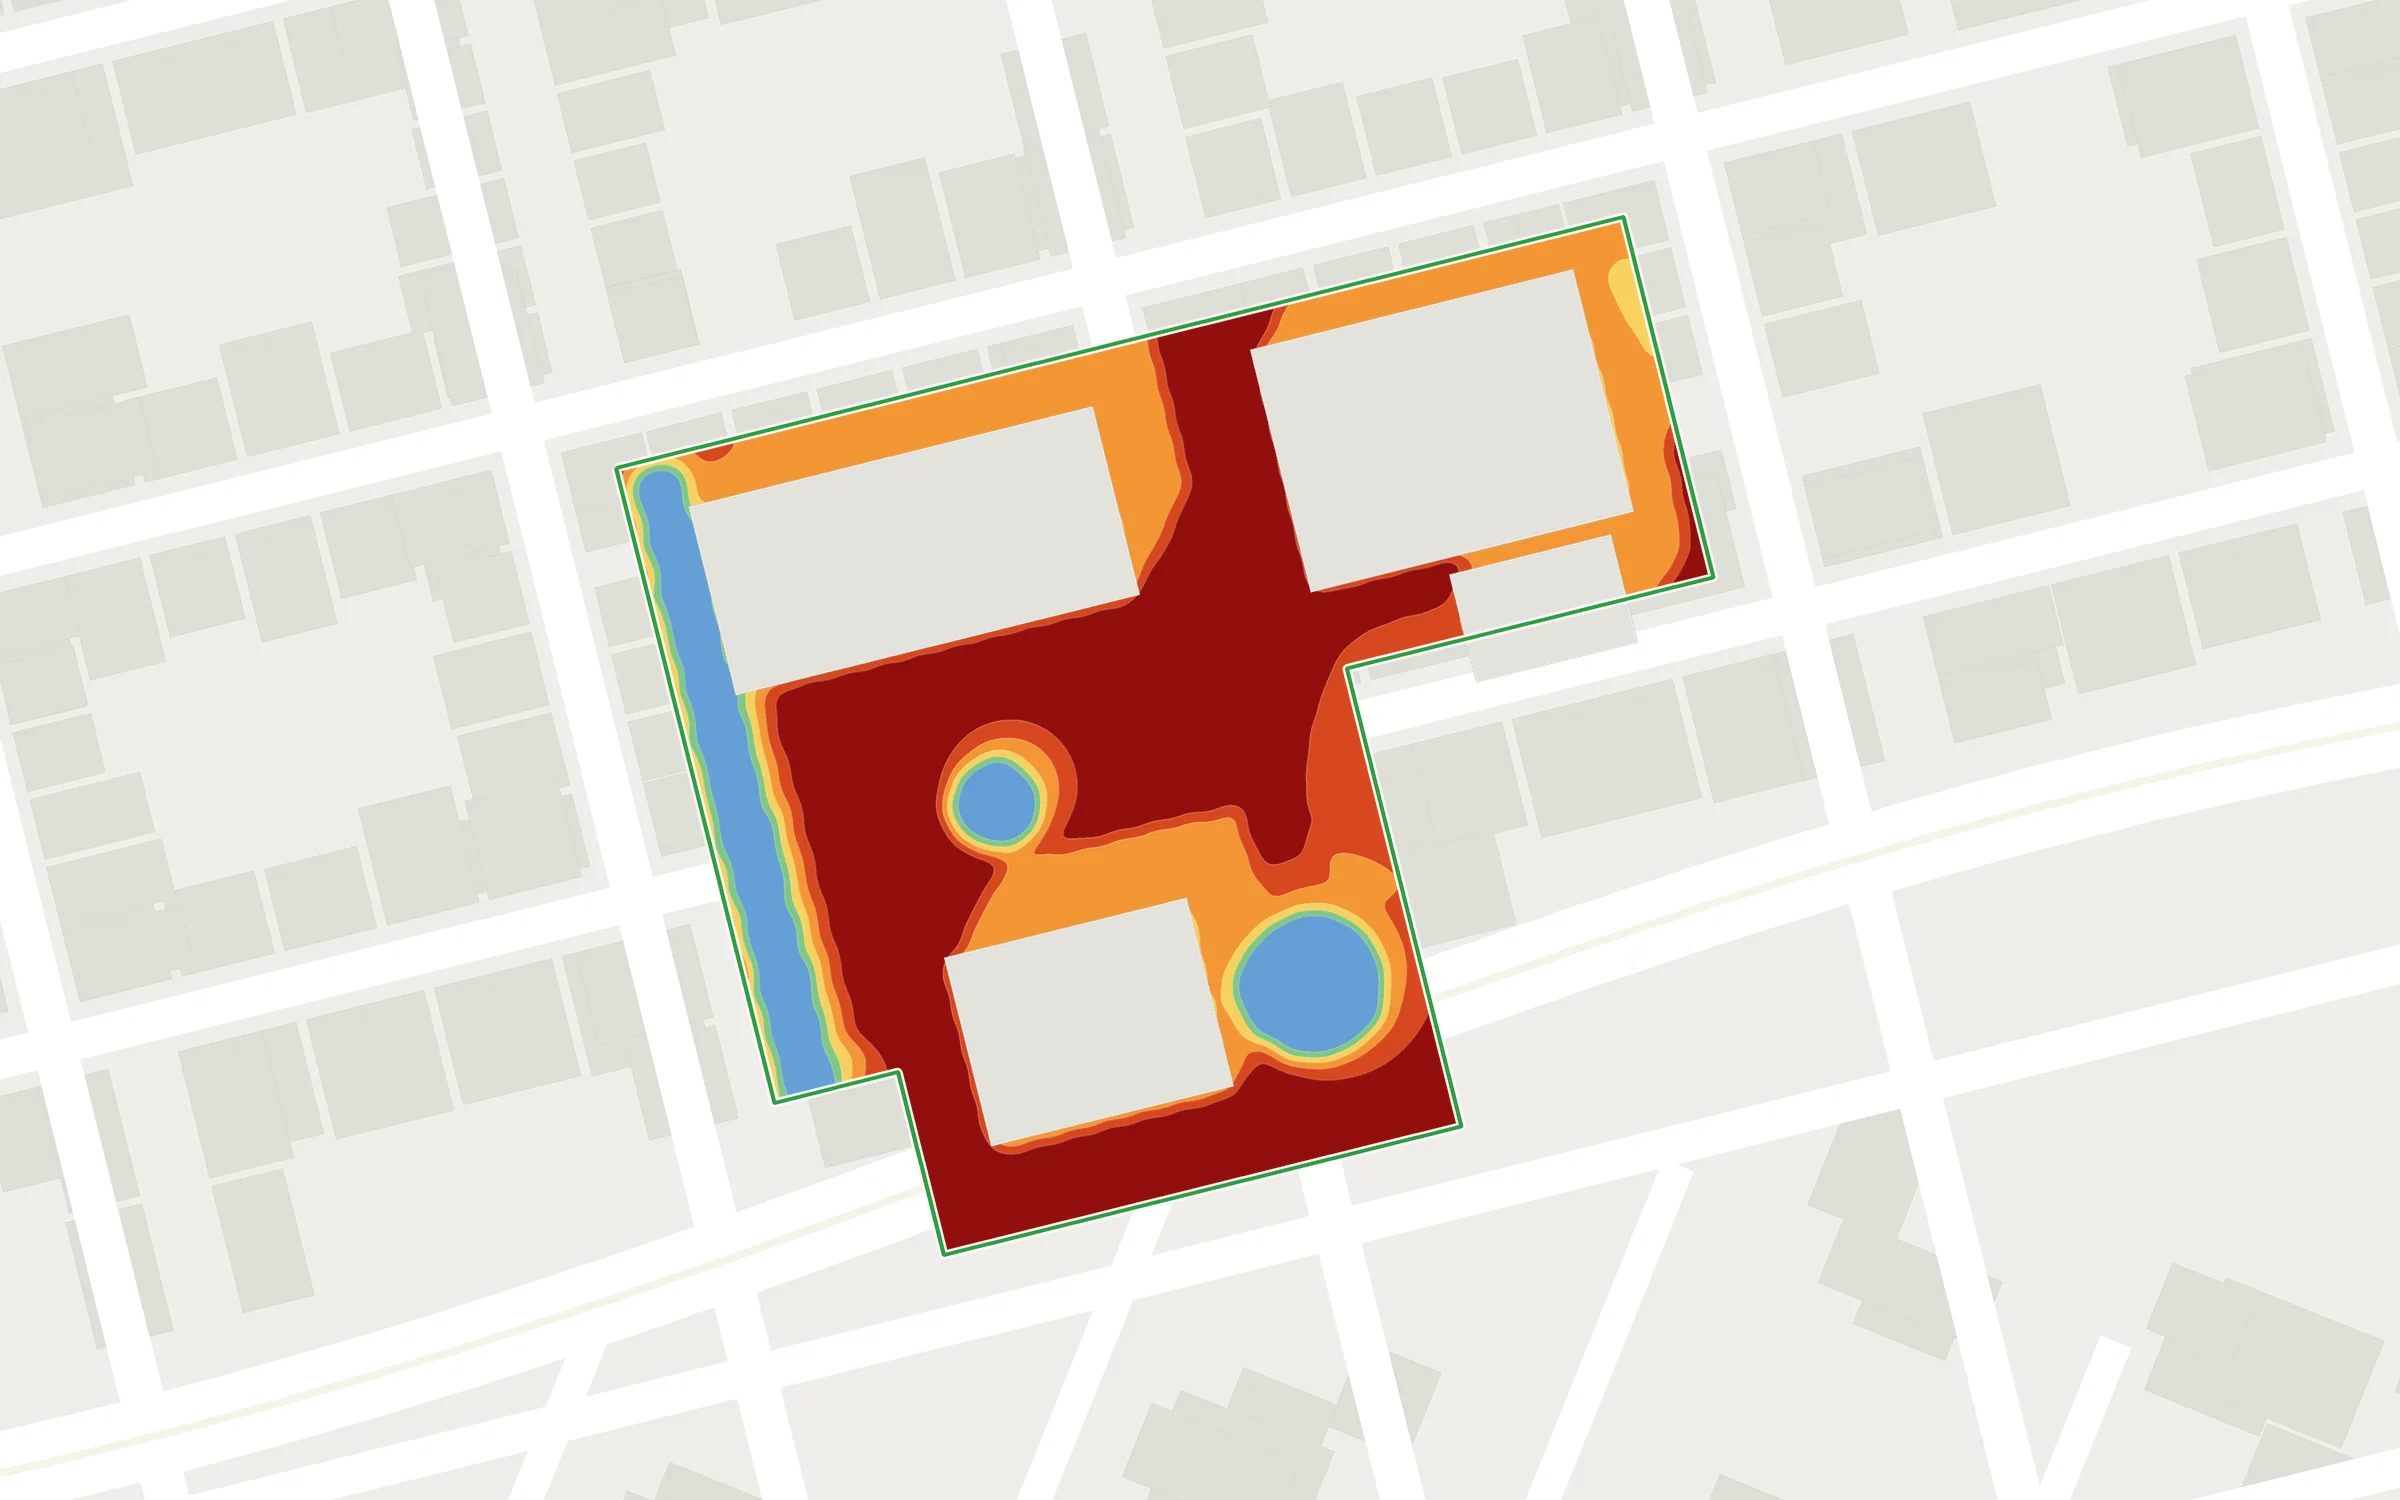
perceived temperature al map of a site's initial condition, with three sensitive areas marked123
Points to Consider
1
urban heat islandIt felt like 41 °C at 2 p.m. on the central plaza
2
Waterproofing72% of surfaces are impervious
3
Forest coverOnly 9%, concentrated along the forest edges
02

Simulate the impact of your project

Design directly in the app or import your plans, specify plants and materials, then view the results and adjust the design to optimize its impact.

Click on a step to view it

  1. Import the drawing.dwg file or drawing into the application
  2. Enter information about plants and materialsSpecies, size, type, and color of the soil
  3. View and AdjustResults by indicator, customizable scenario
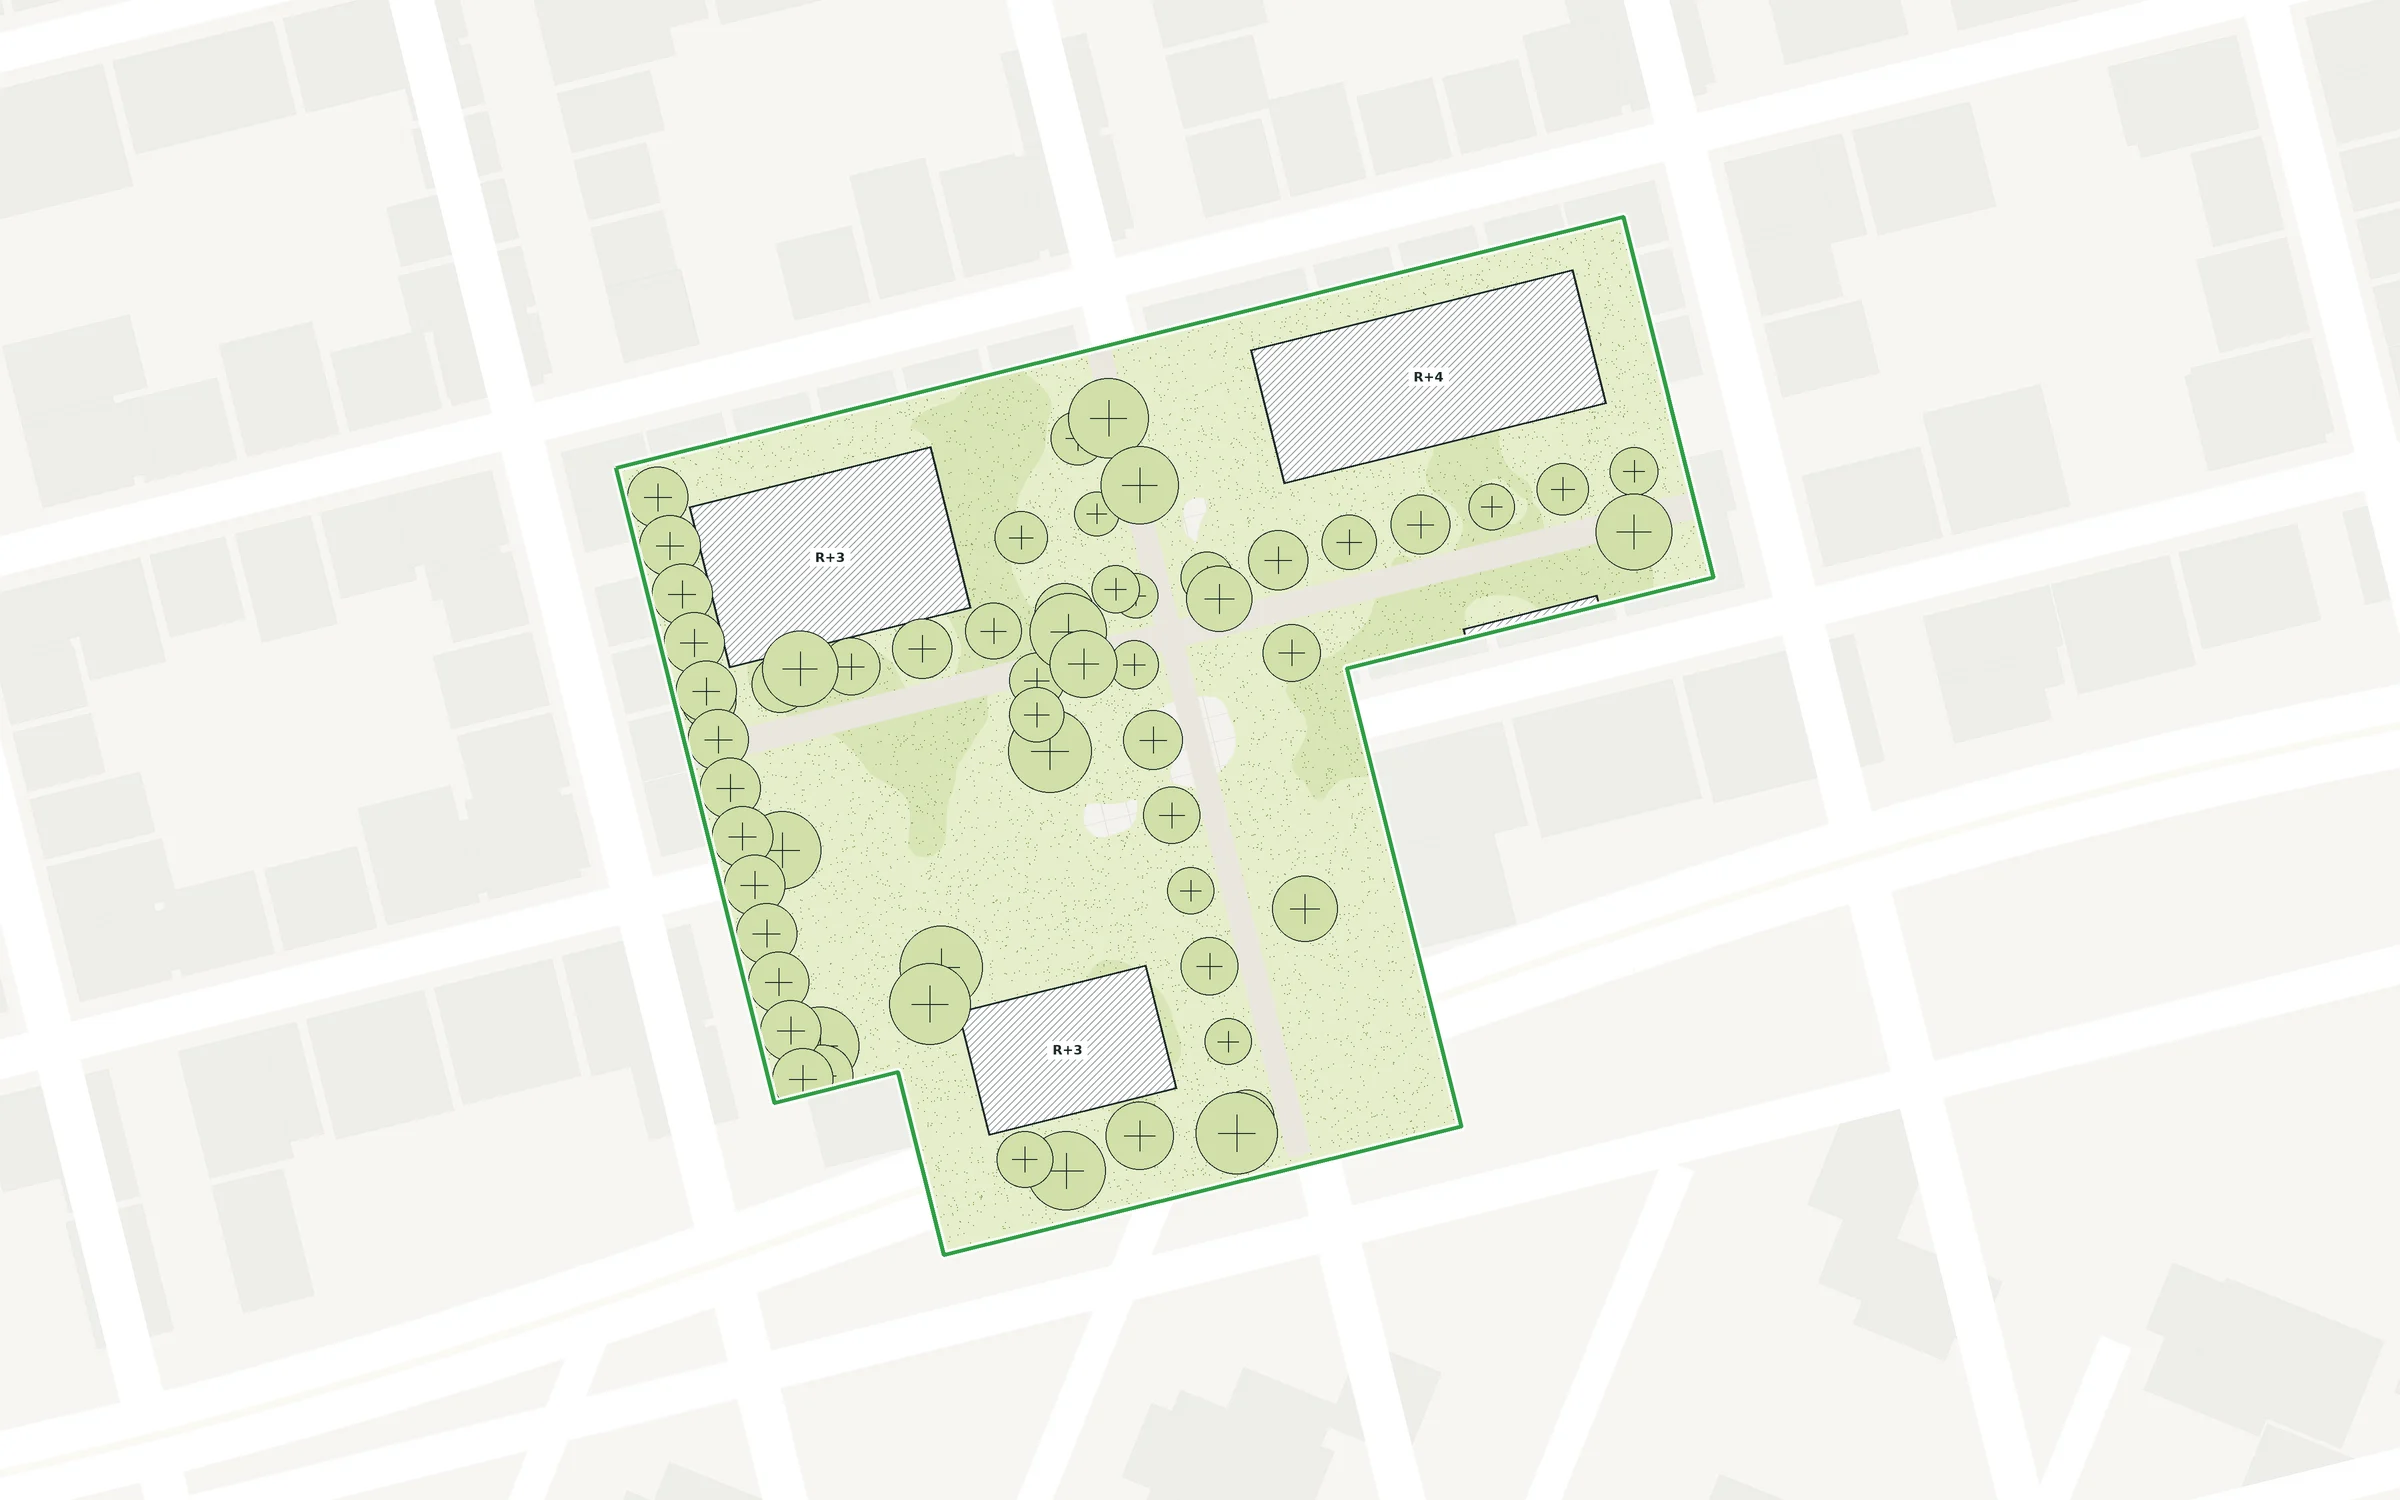
site plan Imported: planned buildings, trees, and green spacesDWGplan_mass_scenarioB.dwg (Imported)
Plants
Small-leaved Linden18
Field Maple 12
Flowering meadow: 1,450 m²
Materials
Concretewith an albedo of 0.45
Paving stones withgrass-filled joints:620 m²
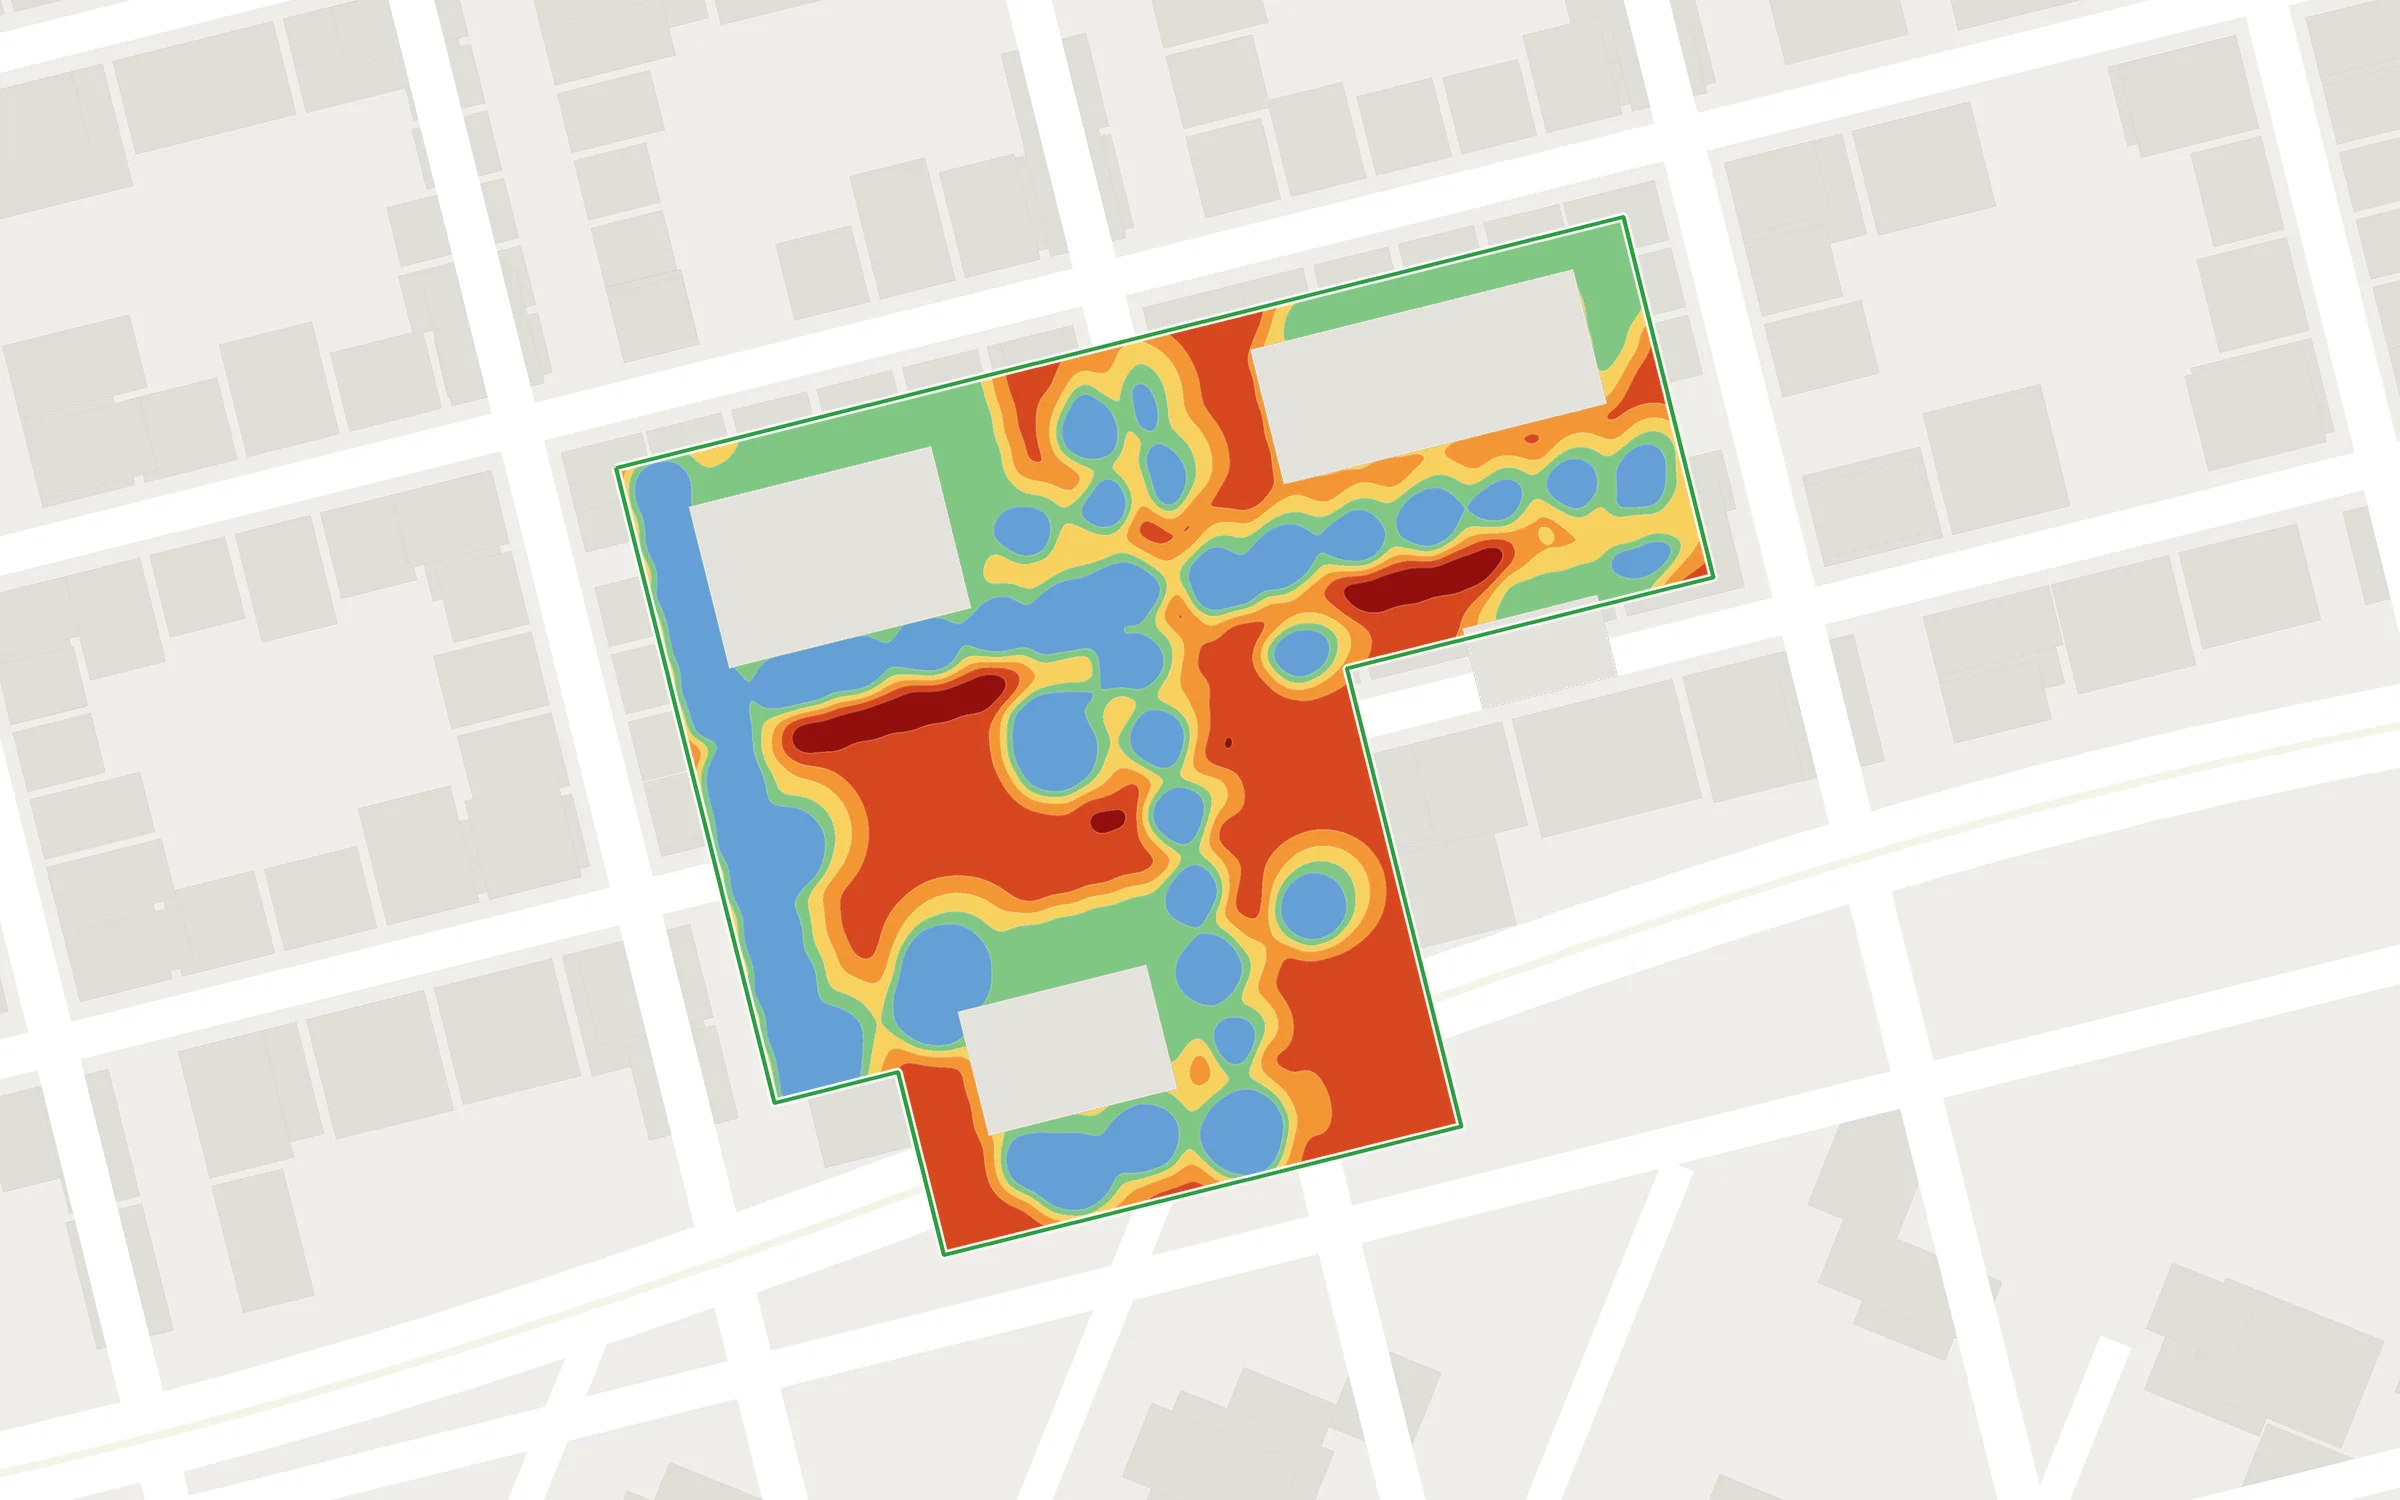
Simulation results: Map of perceived temperature , post-project
perceived temperature at 2:00 p.m.−4.2 °C38.6 → 34.4 °C, a hot day
03

Track over time

Visualize the impact of your projects over the next 25 years and track changes in key indicators to guide your actions over the long term, using climate projections through 2100.

  • 25-Year Forecast
  • Carbon stock every 5 years
  • Climate Projections Through 2100
Carbon Stock · Îlot des Tanneurs
Today214 metric tons of CO₂
At age 25612 metric tons of CO₂
Gain+398 tCO₂
04

Certify and share your results

Create reports that comply with official guidelines and showcase your projects to your partners, funders, or citizens using concrete, verifiable evidence.

  • Label Bas Carbone (French low-carbon label) Ville Arborée, GHG Protocol
  • Presentation-Ready PDF Summary
  • Exports to spreadsheets and GIS layers
Eligibility CheckLabel Bas Carbone (French low-carbon label) · Method Ville Arborée
  • Project scope defined3.2 ha
  • Described plantations (tree species, density)30 trees
  • Carbon savings over the project's duration+398 tCO₂
  • Documented Baseline ScenarioInitial State 2024
Eligible
PDFCSVGIS
Integrations

In your tools, not next to

Netcarbon Integrates into your workflow: your input plans, your standard output formats, and an API to retrieve your property surveys in your GIS tools.

For the appetizer
.dwg drawings
Drawing in the app
NetcarbonDiagnostics · Simulation · Monitoring · Certification
On the way out
PDF Summary
CSV Spreadsheet
GIS Layers
API
Data and Methods

Results reliable and verifiable

The indicators are based on high-resolution imagery, data spanning several years, and methods recognized by official authorities.

20 cm – 1 m

Map Accuracy

20 cm for soil classification, 1 m for surface temperature, thermal comfort,shade , and wind.

2018

History BD Ortho

The evolution of your sites since 2018, as tracked by IGN's " BD Ortho " annual reports.

2100

Climate Projections

Your projects tested against IPCC climate scenarios.

LBC · GHG

Recognized Executives

Label Bas Carbone (French low-carbon label), GHG Protocol, index UTCI for the thermal comfort.

View the seven indicators
Our Offer

Two ways to work together

Whether you work independently within the app or with support from our teams on a project, the plan and pricing are tailored to your business and the scope of your project.

Subscription

The full-featured app

  • Full, unlimited access to the app
  • Unrestricted diagnostics, simulations, and certifications
  • Monitoring of all your land development and restoration projects
  • Label Bas Carbone (French low-carbon label) and GHG Protocol
  • Exporting Data from the Application
Get a quote →
Study

End-to-End Project Support

  • One-time access to the app for a project
  • Simulation and Synthesis with Dedicated Support
  • Multi-indicator analysis of the project's impacts
  • Detailed report prepared by our teams
Get a quote

Selon votre métierAménageurs & constructeursCollectivitésFoncières & bailleursInfrastructures

Frequently Asked Questions

Before you begin

Do you need GIS skills to use Netcarbon ?

No. The app runs directly in the browser: you draw or import your area, and the metrics are calculated for you. The results can still be exported as GIS layers for teams that wish to do so.

What types of files can I import?

Your floor plans in .dwg format. You can also model your project directly in the app.

Where does the data come from?

Aerial imagery (BD Ortho from the IGN) and satellite imagery, classified by land cover at 20 cm resolution, with data dating back to 2018. Temperature, thermal comfort, shade, and wind maps are calculated at 1 m resolution. All of this is supplemented by IPCC climate projections through 2100.

Are the results verifiable?

Yes. The application generates files that comply with official standards, including the Label Bas Carbone (French low-carbon label) ( Ville Arborée method) and the GHG Protocol.

How much does " Netcarbon " cost?

The price depends on your industry, the size of your organization, and the plan you choose—whether it's a subscription or a one-time assessment. Request a demo, and we'll send you a customized proposal.

Demonstration

Measure the impact of your next project, starting with the initial sketch.

30 minutes on an area of your choice, with an expert Netcarbon.

Book a demo →

Any other questions? Write to us