FREN Book a demoDemo →
Local authorities

Leading the ecological transition in your region

Netcarbon enables Local authorities to map their territory, identify areas of concern, and simulate the impact of their future development projects. A key solution for integrating adaptation, restoration, and transparency.

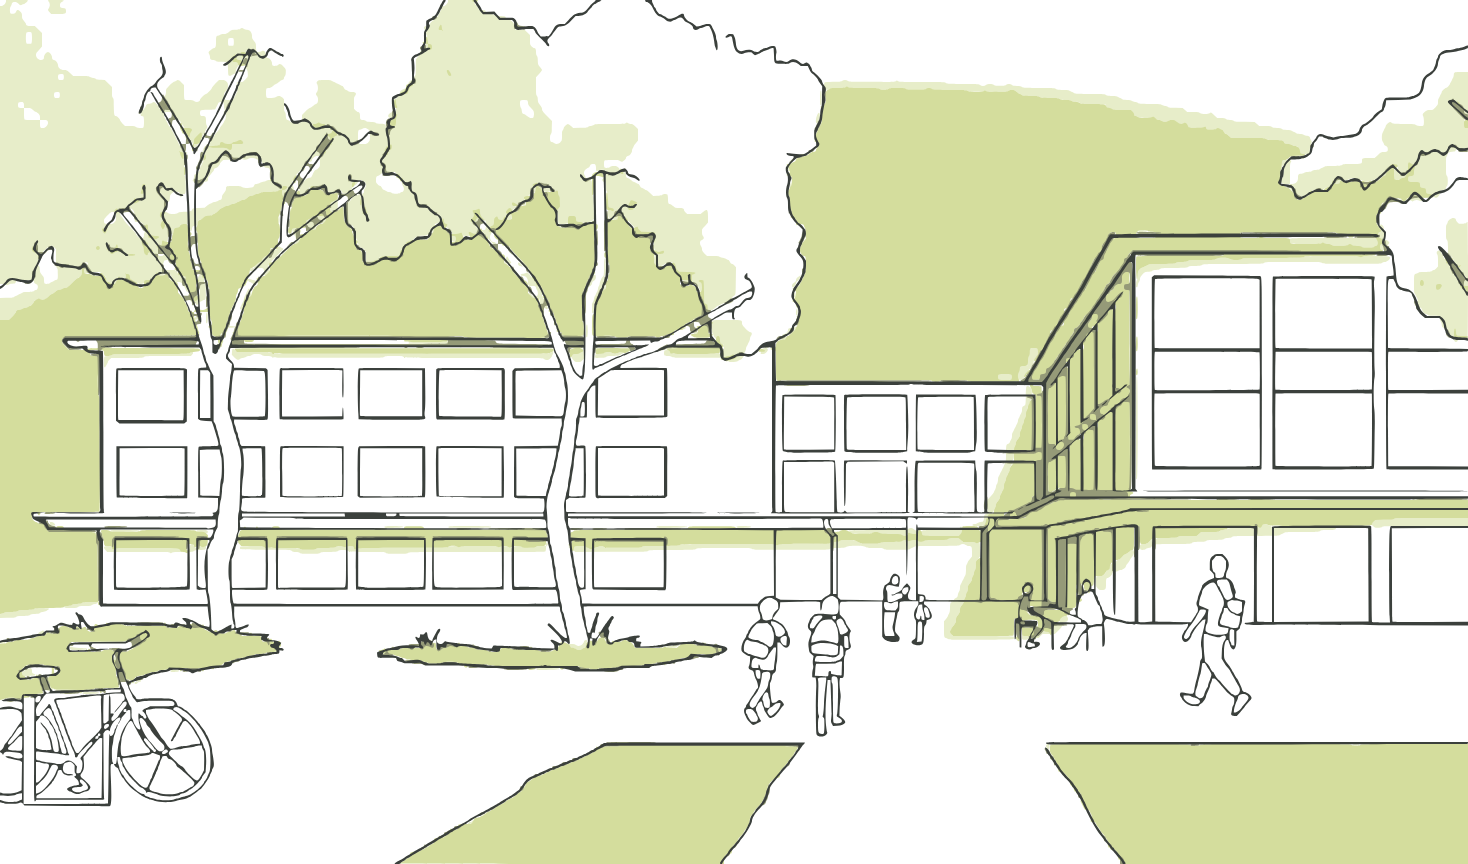
Drawing of a school with trees and passersby
Sample Projects:Schoolyards, parks and public squares, streets and plazas, landscaping plans, local climate plan (PCAET)
Use cases

From assessment to priority projects

Four ways to monitor your region, anticipate future climate conditions, and launch the right projects.

1/4

Track Changes in Your Area

Track changes in your land holdings over time using environmental indicators. Incorporate data from Netcarbon into your local climate plan (PCAET) or your end-of-term report.

  • BD Ortho 's History Since 2018
  • Reading by neighborhood or sector
  • Data ready for the local climate plan (PCAET)
vegetation cover by sector2018 → 2024
Territory31.4%
Since 2018−1.2 percentage points
A Growing AreaSouthern Suburbs
2/4

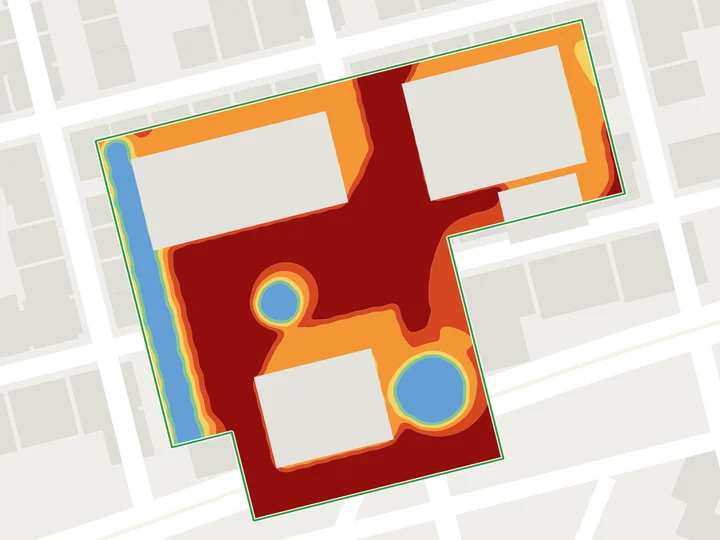
Identify exposed areas

Identify areas vulnerable to heat islands and project their future trends based on IPCC scenarios. Prioritize your adaptation actions objectively.

  • Heat Island Analysis
  • Climate Projections Through 2100
  • Objective Prioritization of Sectors
perceived temperature Today in a neighborhoodperceived temperature projected for 2050
Average at 2:00 p.m.38.6 °CAverage at 2 p.m.41.2 °C
3/4

Implement priority projects

Identify the schoolyards, streets, and squares most at risk using heat island analysis. Simulate restoration projects and demonstrate their impact to secure funding.

  • Schoolyards, streets, and designated squares
  • Simulation of Renaturation Projects
  • Data-Driven Arguments for Your Financing
Priority Sitesperceived temperature At 2 p.m., a hot day
  1. 1Les Tilleuls School ComplexSchoolyard41.2 °C
  2. 2Market SquareSquare40.6 °C
  3. 3Rue des ÉcolesStreet39.8 °C
  4. 4Town Hall PlazaPublic space39.1 °C
Simulate a restoration project →
4/4

Optimize and Certify the Impact of Your Projects

Compare several scenarios for your landscaping projects and refine your choices of materials and plants based on their actual impact.

  • Comparison of Scenarios Based on the Same Indicators
  • Selection of Wood Species and Materials
  • Label Bas Carbone (French low-carbon label) Ville Arborée
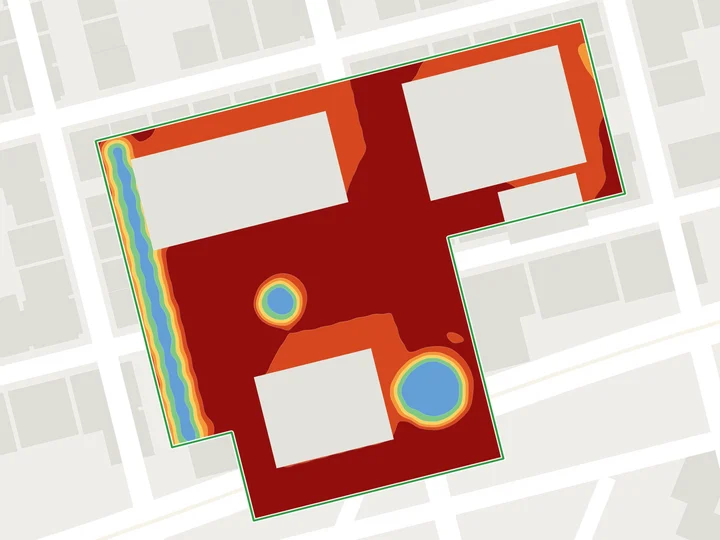
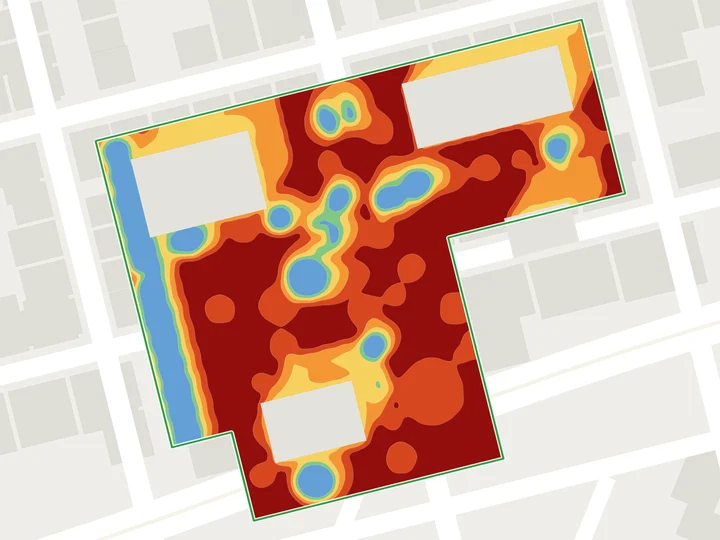
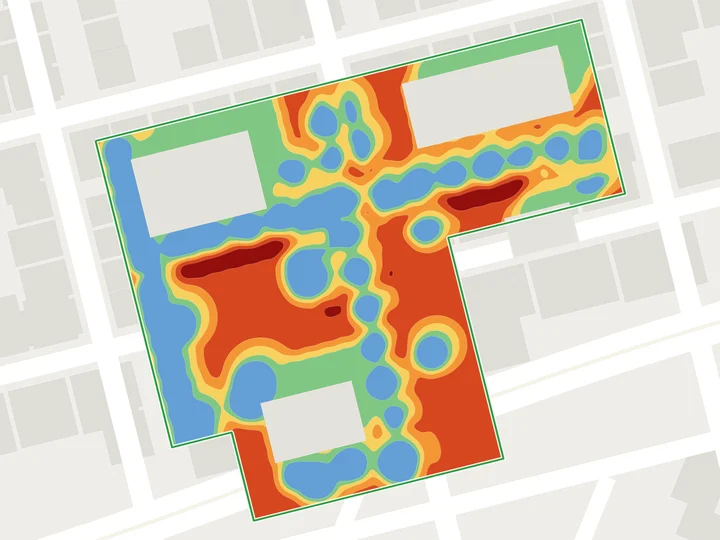
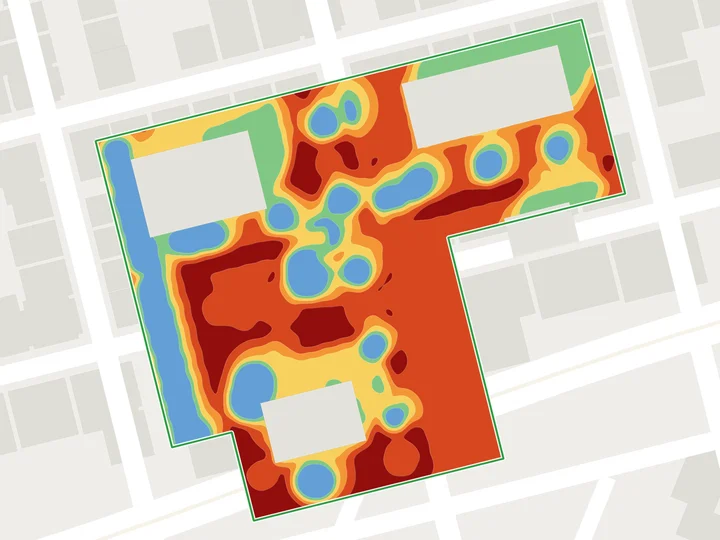
Mineral LandscapeLandscape DesignMixed scenario
Scenario A37.9 °CScenario B34.4 °CScenario C36.1 °C
Reference Project

The Combes

AntibesCity of Antibes20252.6 haImpact Assessment and Certification

Simulation of the project’s environmental impact on carbon stocks, temperature, andland take. In collaboration with the landscape architect, Netcarbon helped optimize the plant selection and design choices to improve the project’s carbon performance and support the attainment of the Label Bas Carbone (French low-carbon label) Ville Arborée .

View the project
−5.5 °Cthermal comfort
+52.3 tCO₂Carbon stock
LBCVille Arborée
2.6 haProject area

Other ProjectsBougainville Park · MarseillePort aux Lions Schoolyard · Charenton-le-Pont

Our Offer

Your region or a project

A subscription to monitor your entire area, or a study focused on a specific restoration project. Pricing is based on the area's size or the project's scope.

Project Proposal

A renaturation project, supported by

  • Assessment of the Site's Initial Condition
  • Simulation and Comparison of Scenarios
  • Summary for Your Elected Officials and Funders
  • Support for Label Bas Carbone (French low-carbon label)
Get a quote
Regional Subscription

Your entire territory in the app

  • History of the region since 2018 (BD Ortho)
  • Mapping Heat Islands
  • Unlimited projects from your departments
  • Climate Projections Through 2100
Get a quote →
Frequently Asked Questions

Local authorities, your questions

Can data power our web local climate plan (PCAET) ?

Yes. The indicators have been tracked since 2018, on a vintage-by-vintage basis BD Ortho, and can be exported as spreadsheet files or GIS layers for your planning documents and reports.

How can we identify which schoolyards should be restored as a priority?

The heat island analysis categorizes your sites based on their perceived temperature , and surface area. This allows you to identify the most vulnerable sites and simulate their transformation.

Do the results help secure funding?

Simulations quantify a project's benefits (temperature, carbon, depaving), which are arguments you can use directly in your funding proposals.

What climate scenarios are used?

The projections are based on IPCC scenarios through 2100.

Demonstration

Measure the impact of your next project, starting with the initial sketch.

30 minutes on an area of your choice, with an expert Netcarbon.

Book a demo →

Any other questions? Write to us