


Taking stock
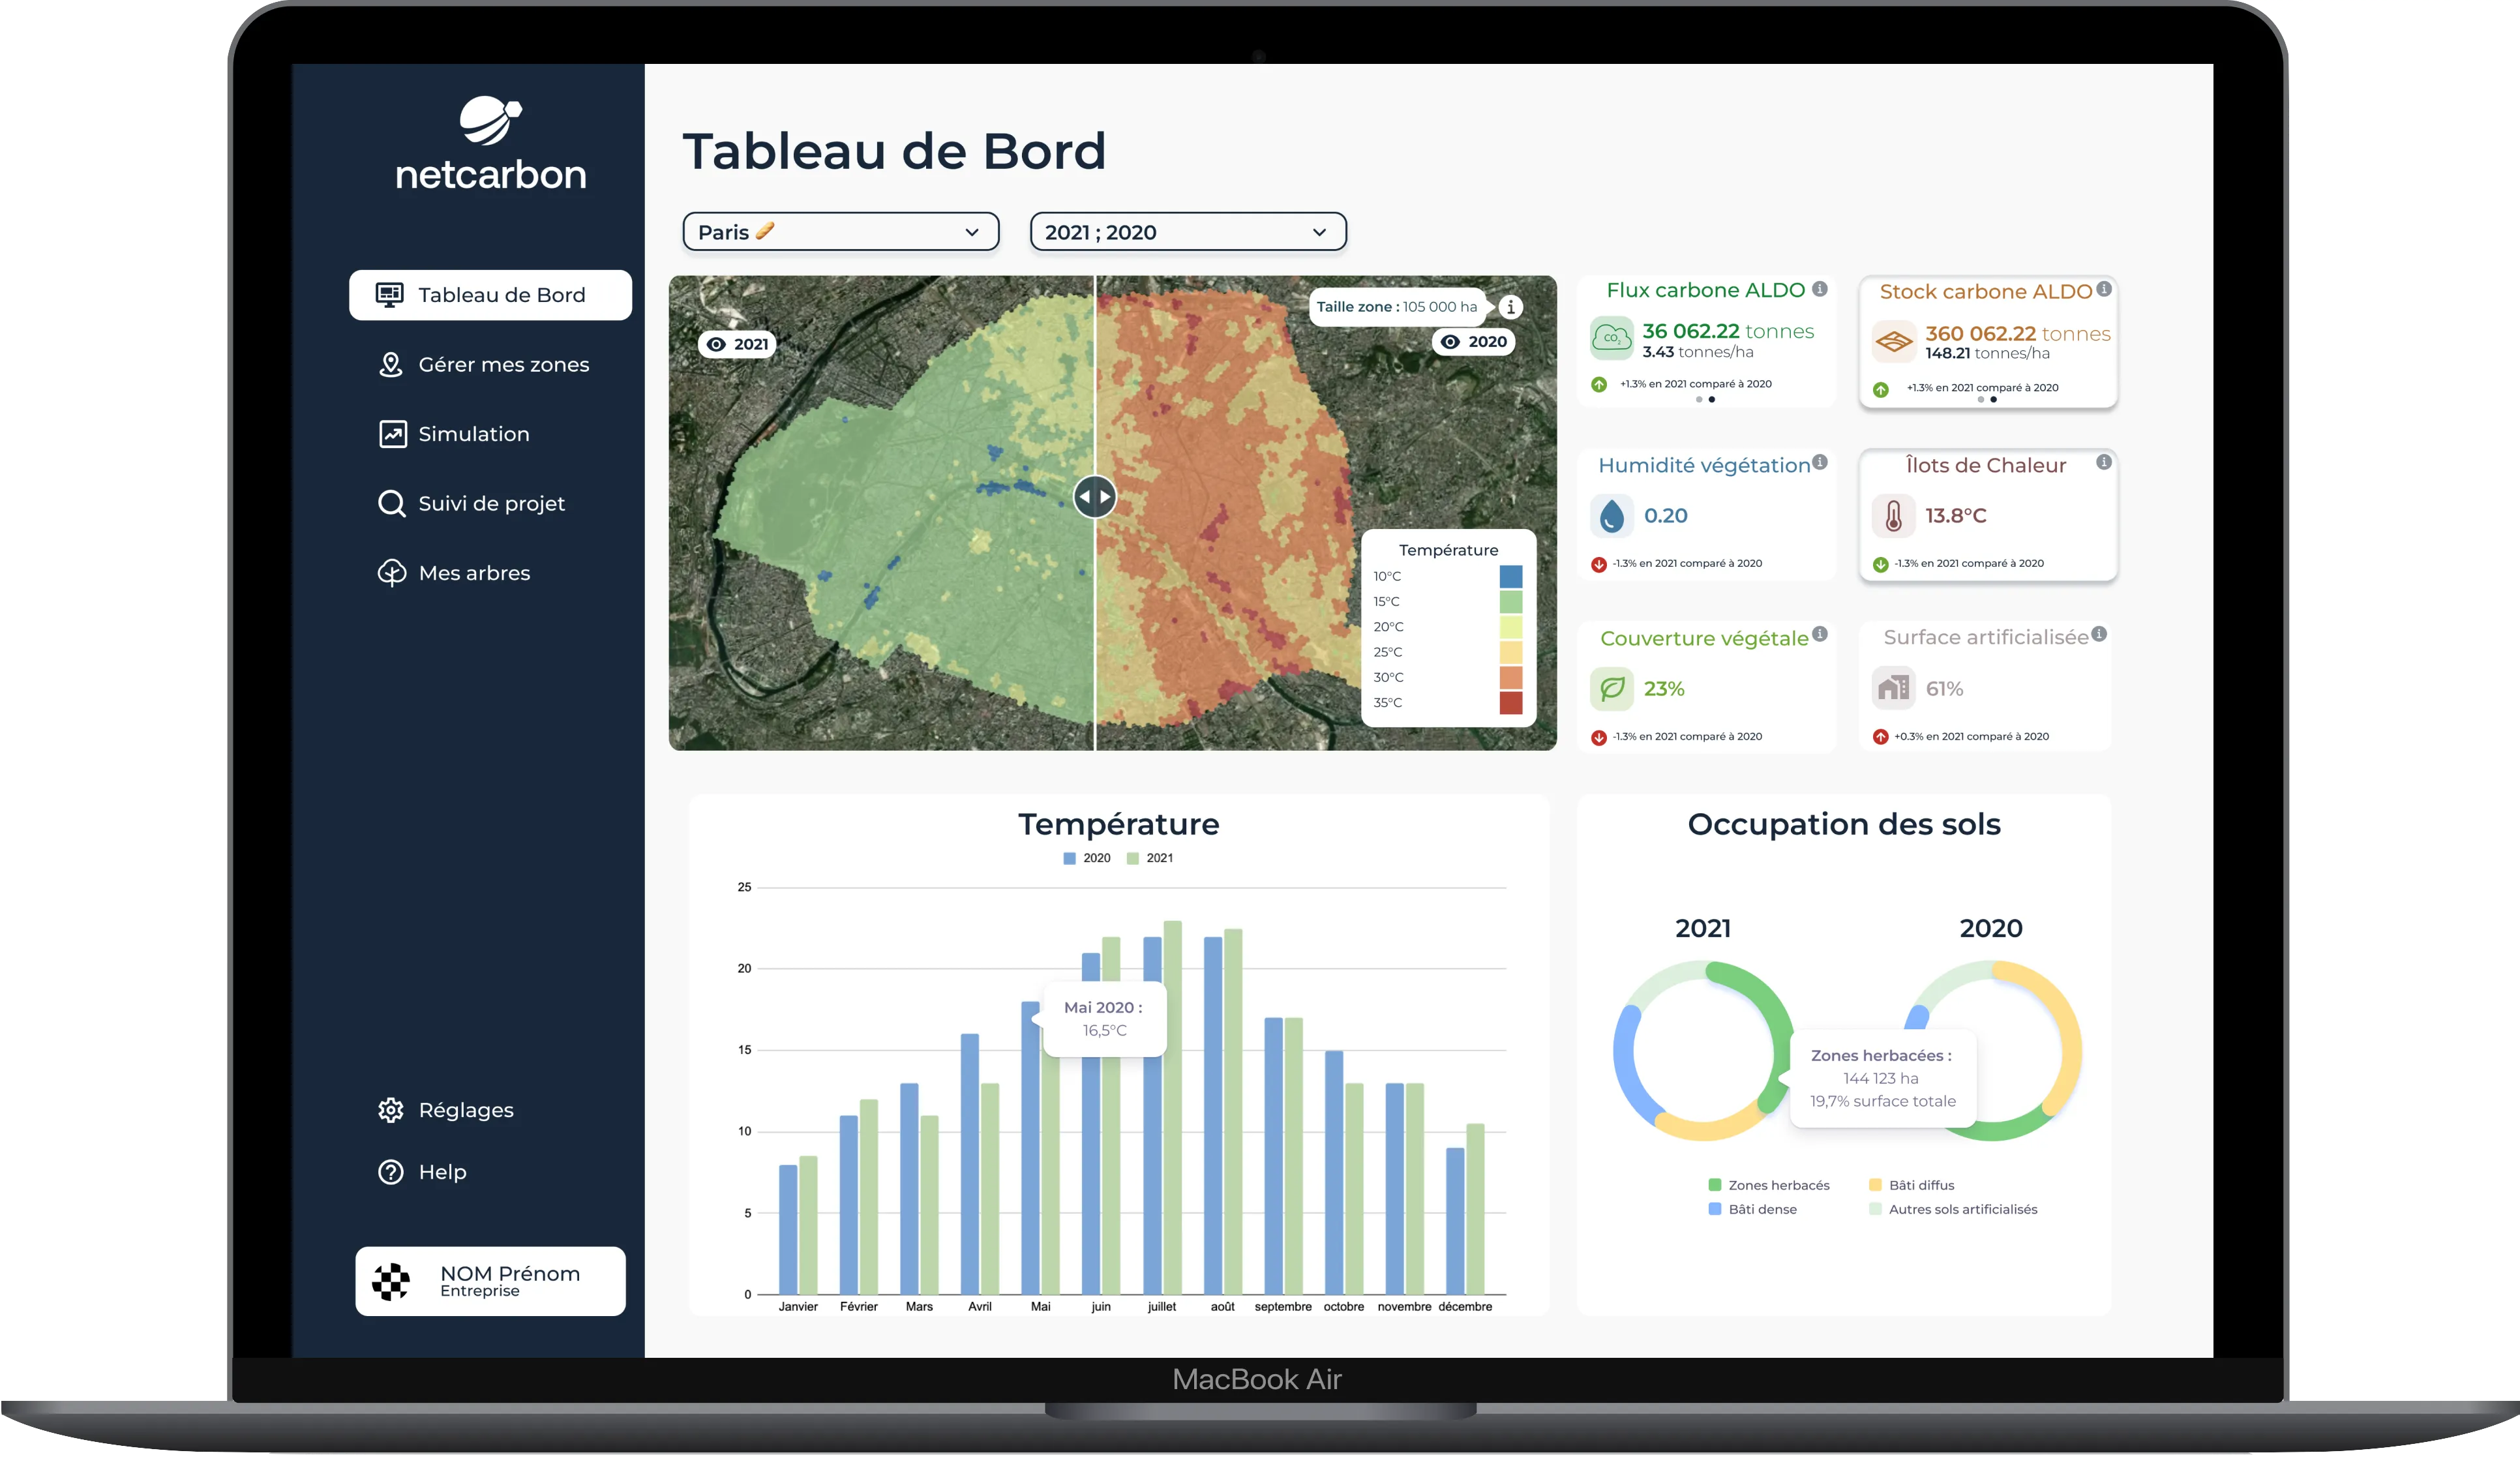
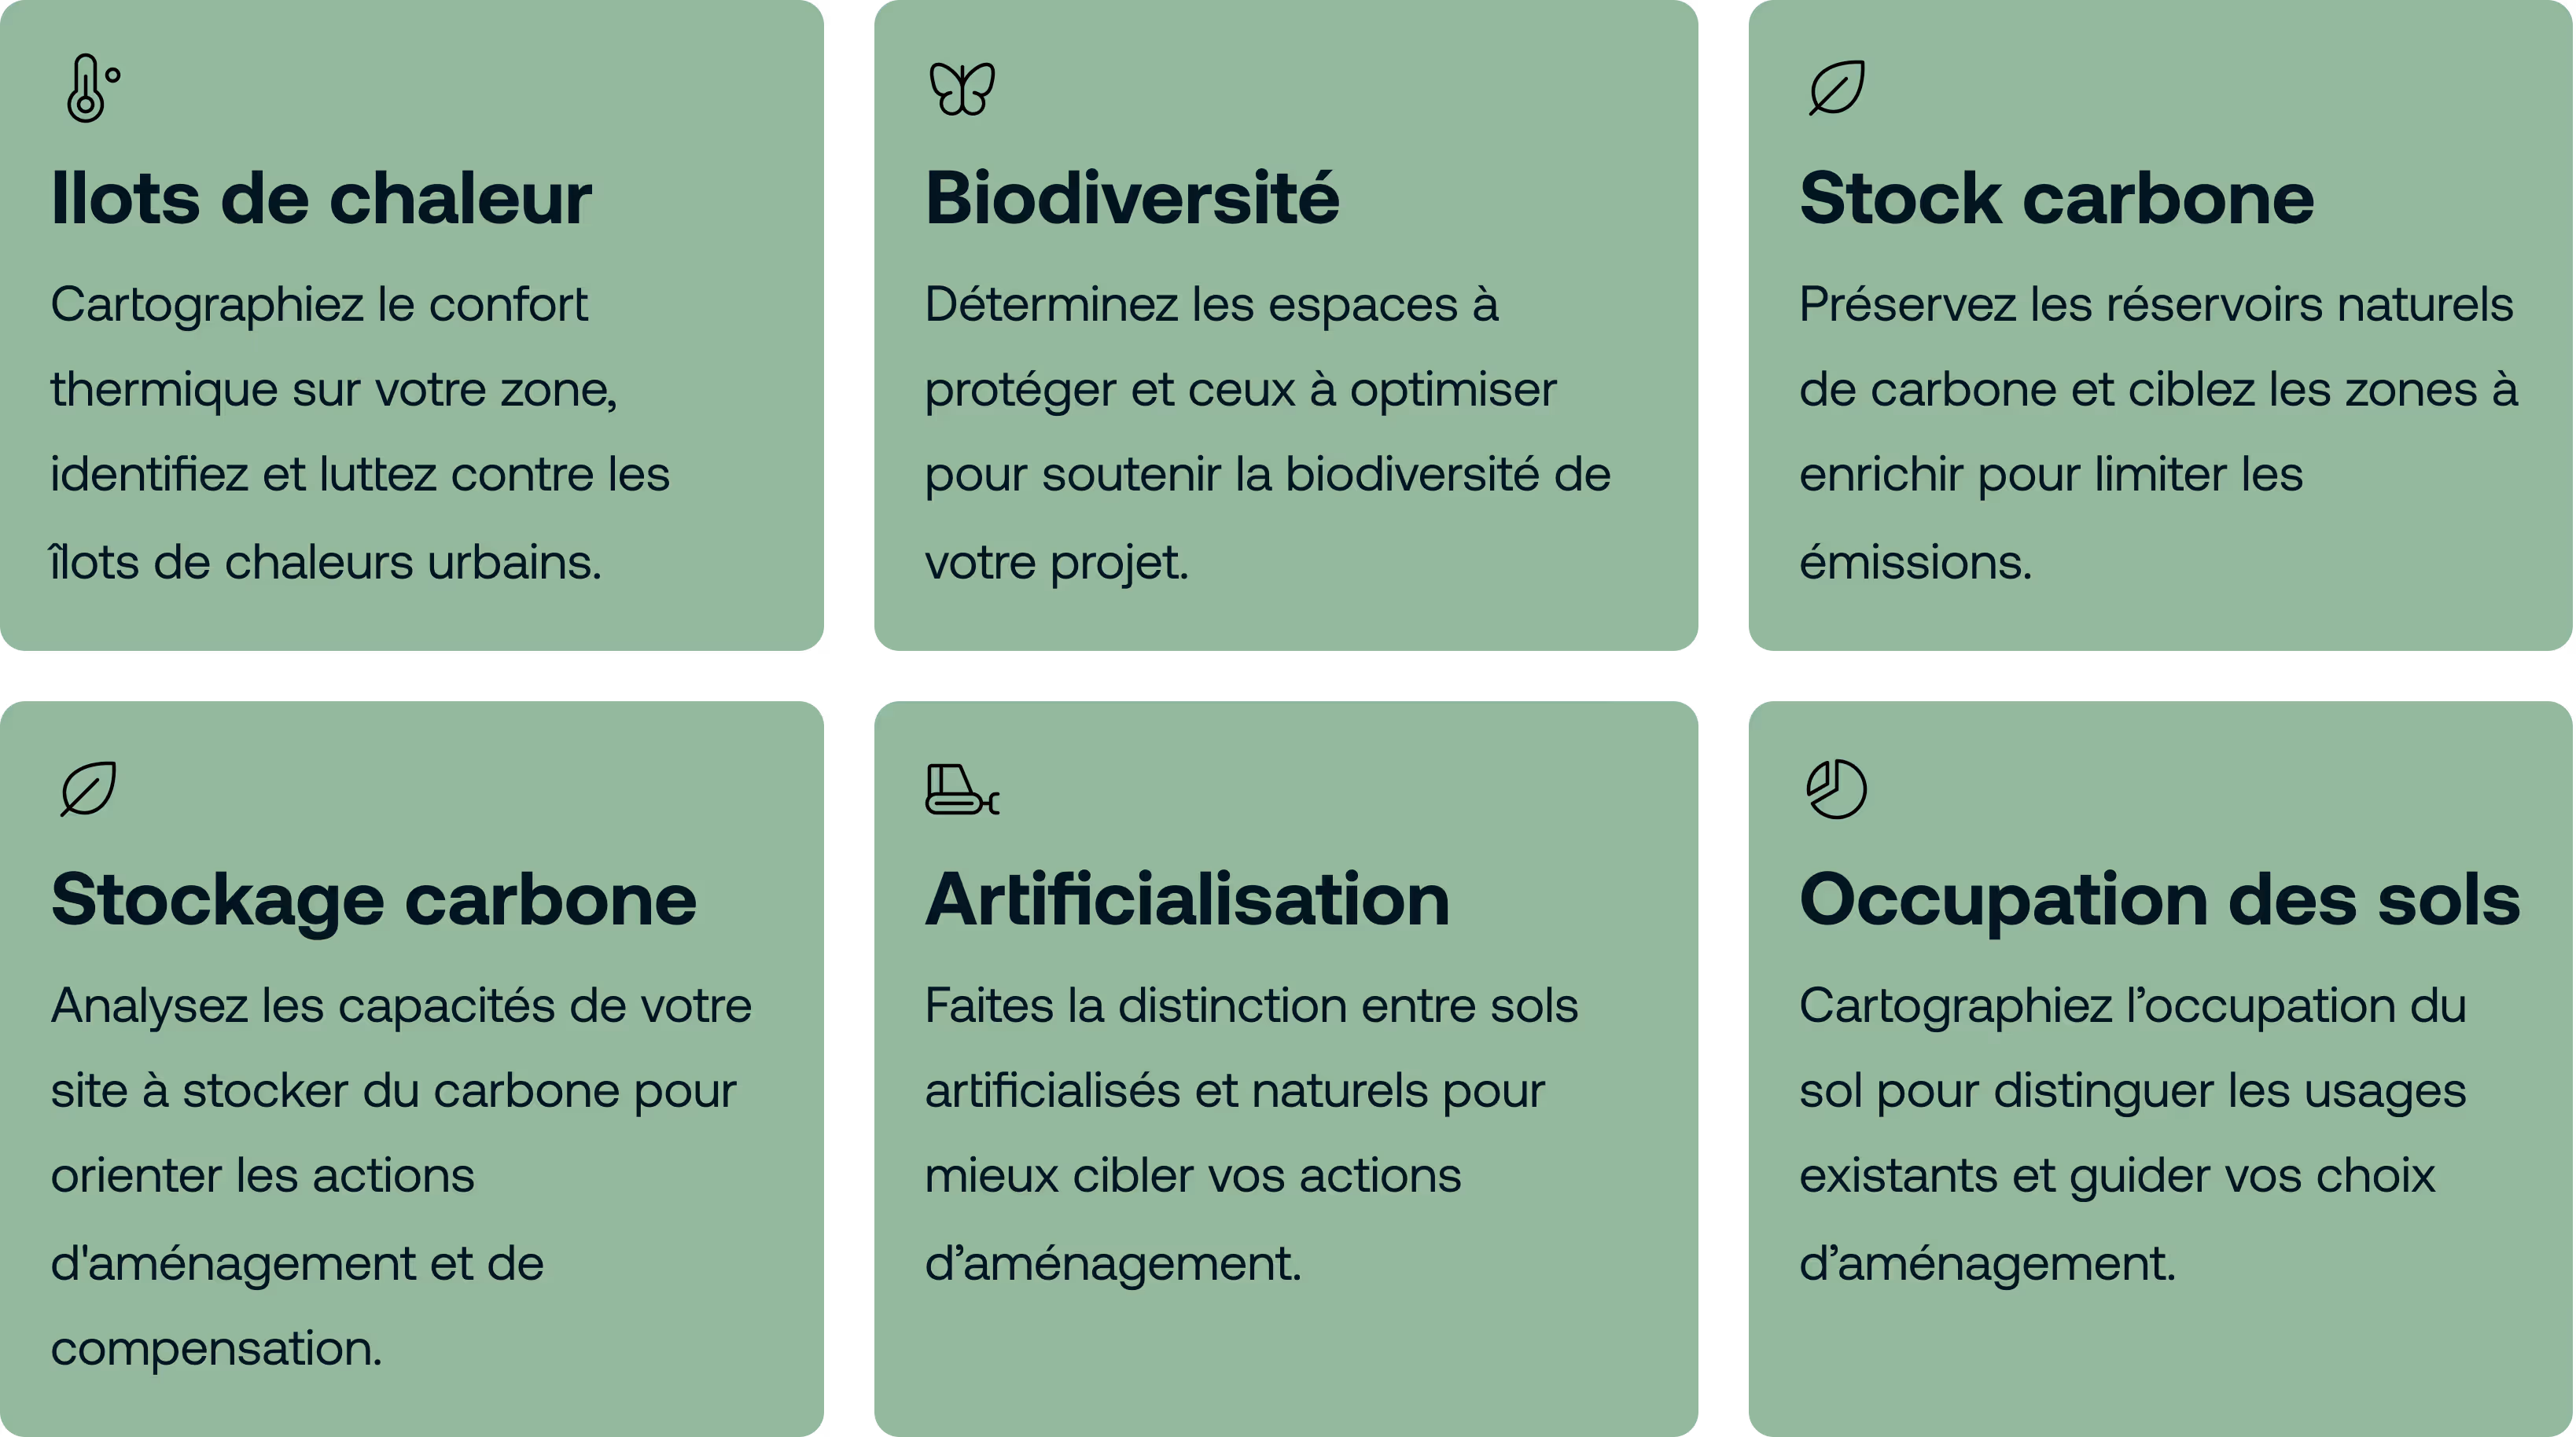
The Netcarbon application gives you access to a set of indicators to carry out a precise inventory of your territory, your assets or your project area, on a panel of environmental indicators.
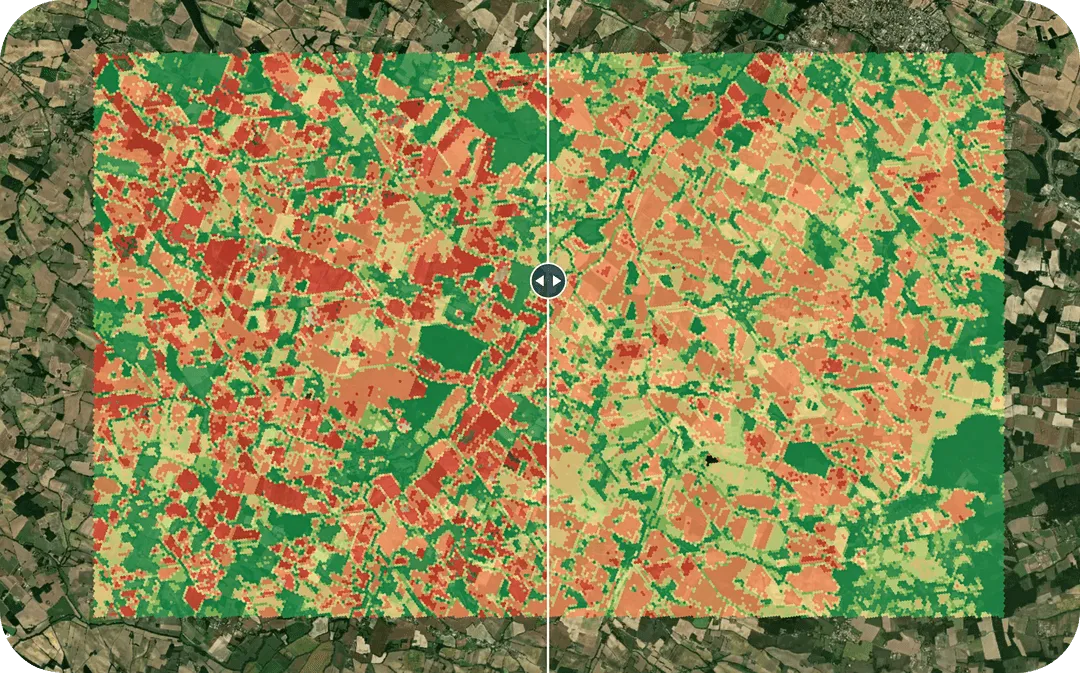
Thanks to the use of aerial and satellite imagery, our indicators have been available since 2018 and feature very high resolution (20 cm).
.webp)

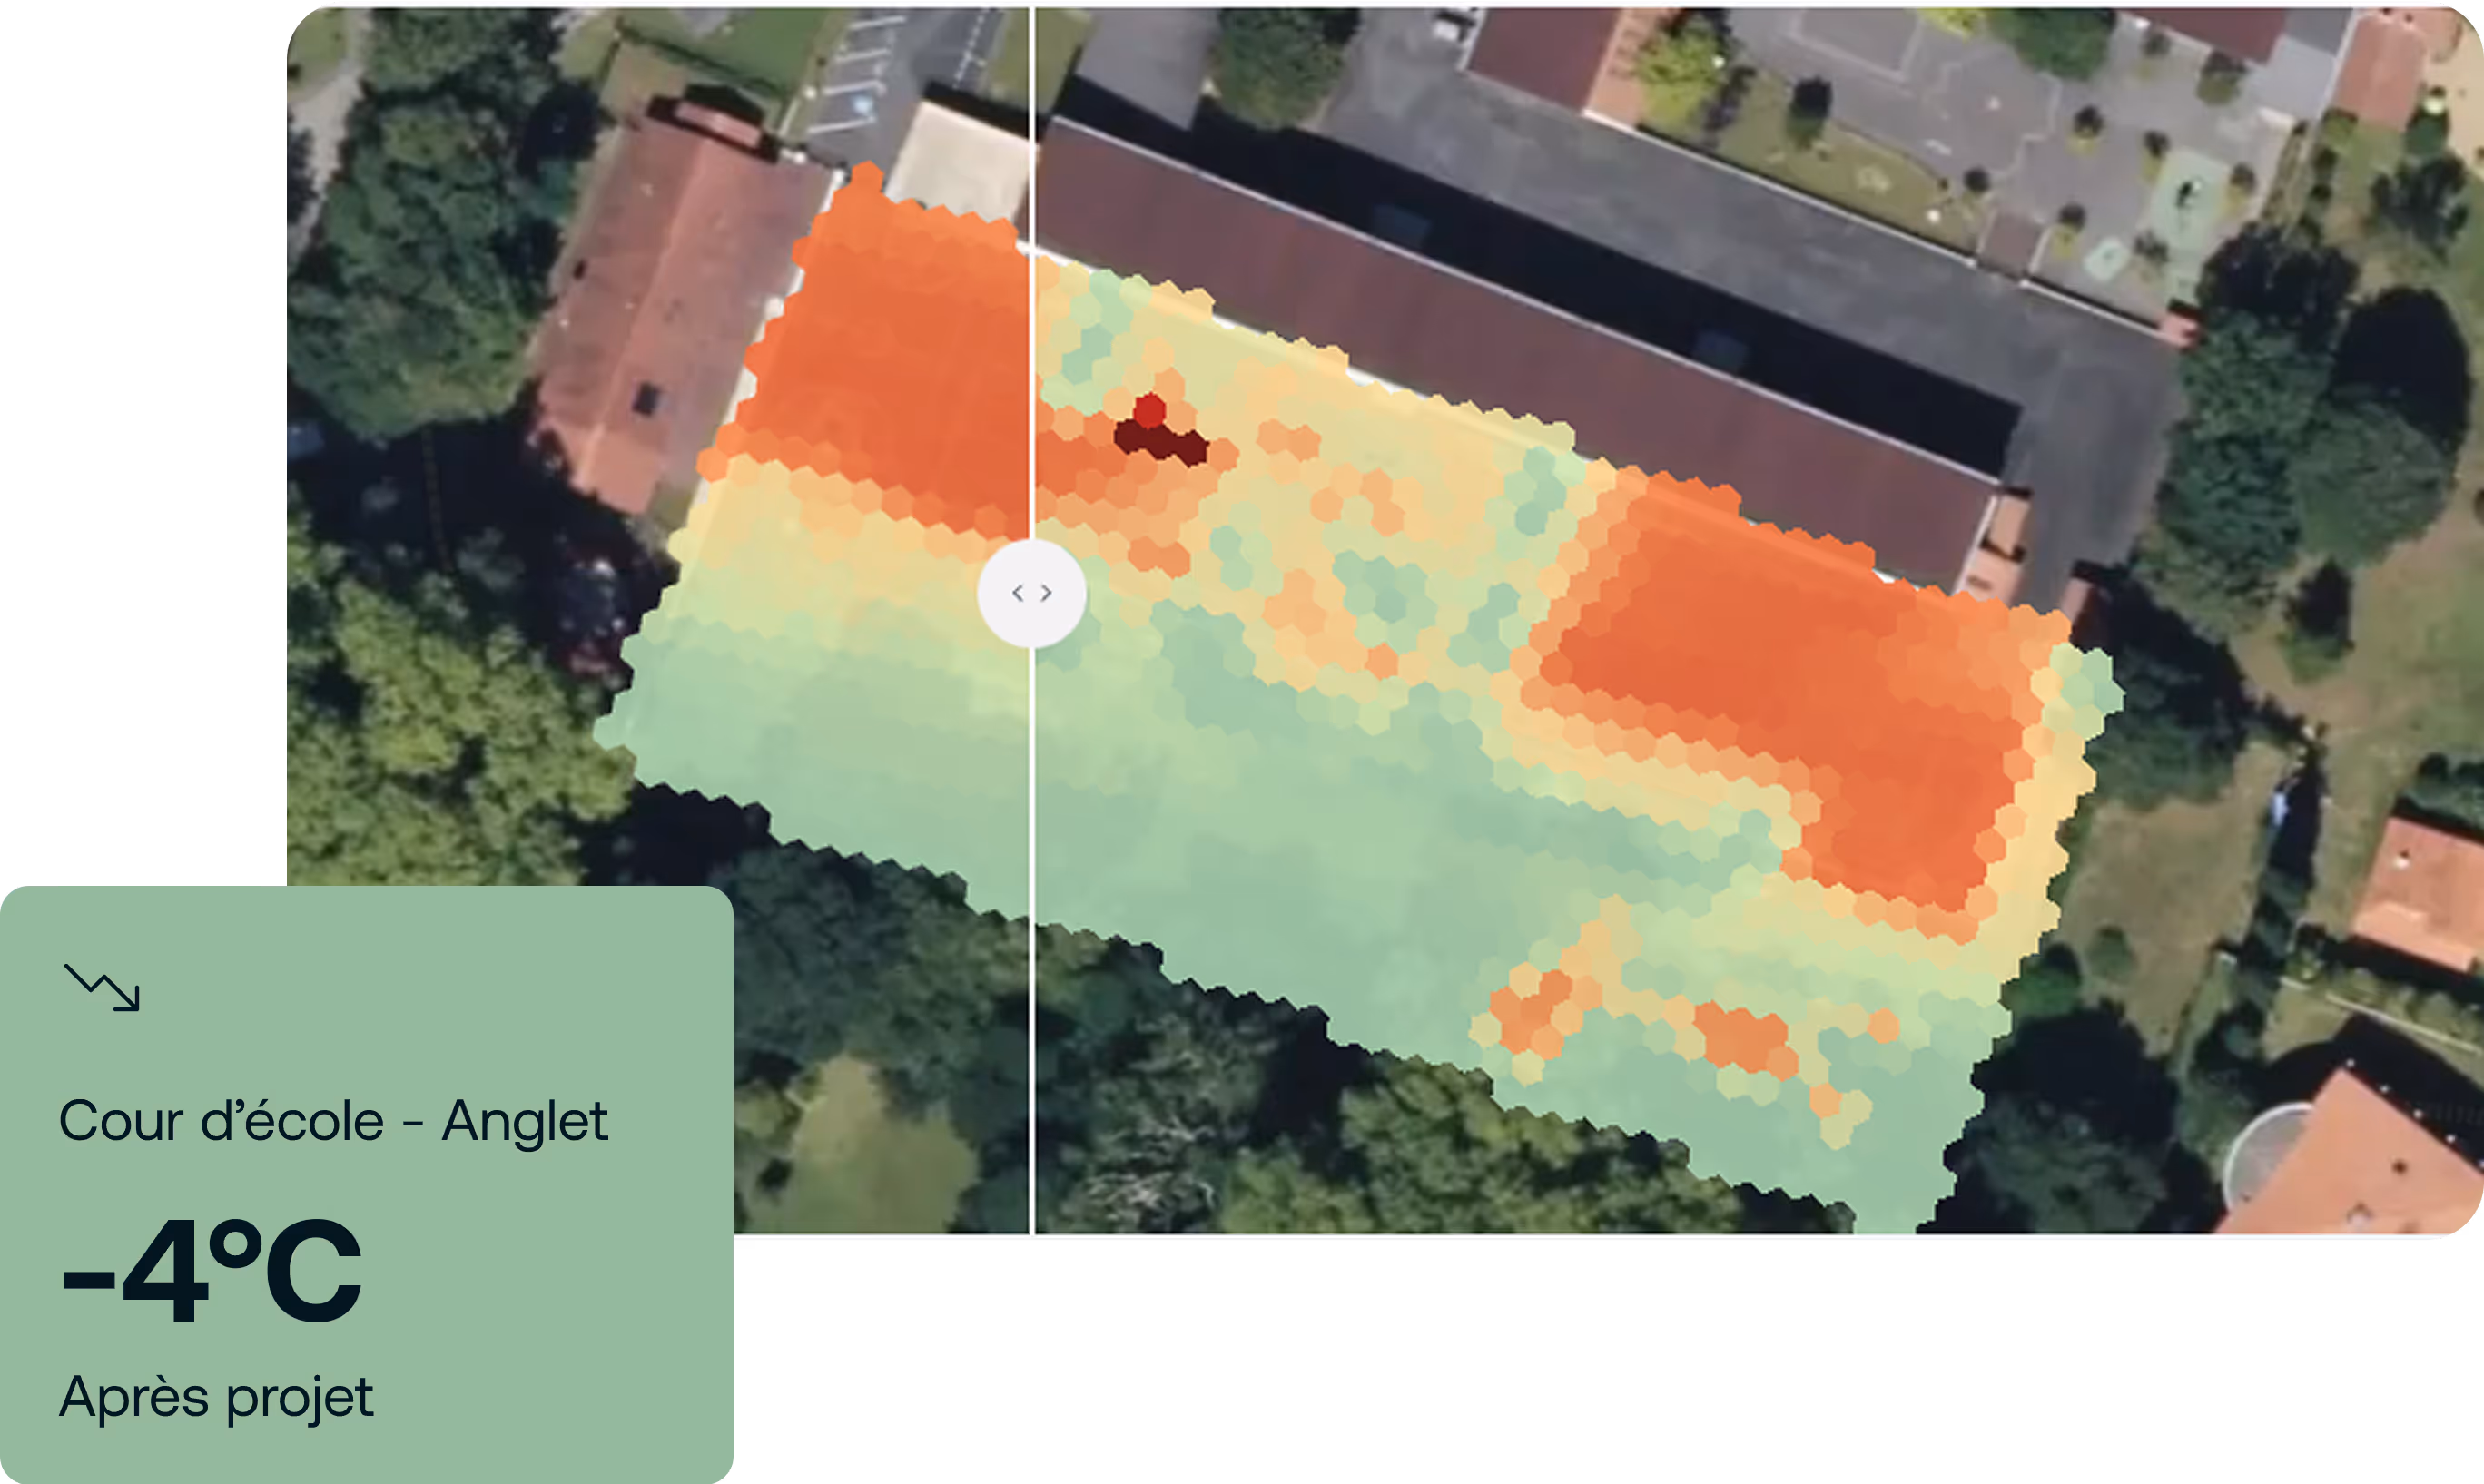
What is the impact of my future project?
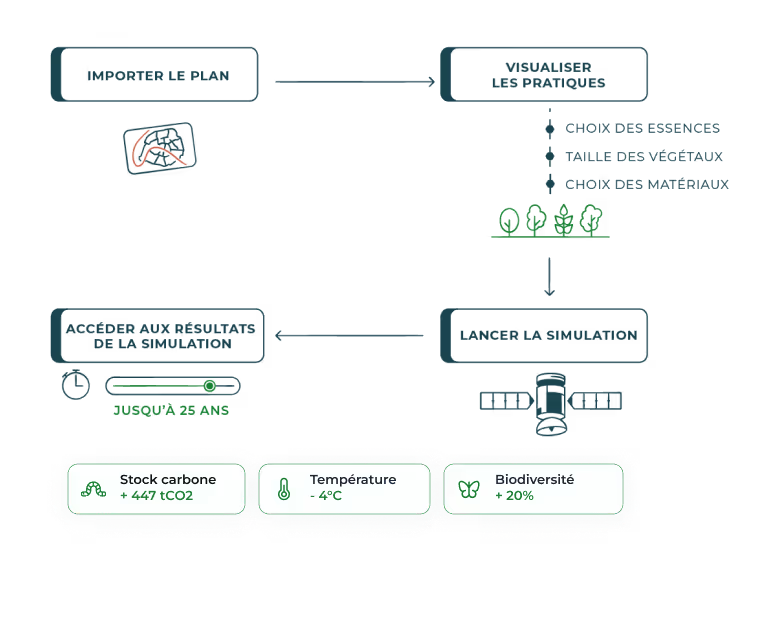
Model your future project and simulate its impact on a set of key indicators:
- Heat islands
- Carbon stocks
- Biodiversity
- Artificialization and soil permeability
Thanks to the Netcarbon application, you can simulate several scenarios (choice of materials, vegetation) to optimize the maximum impact of your project.
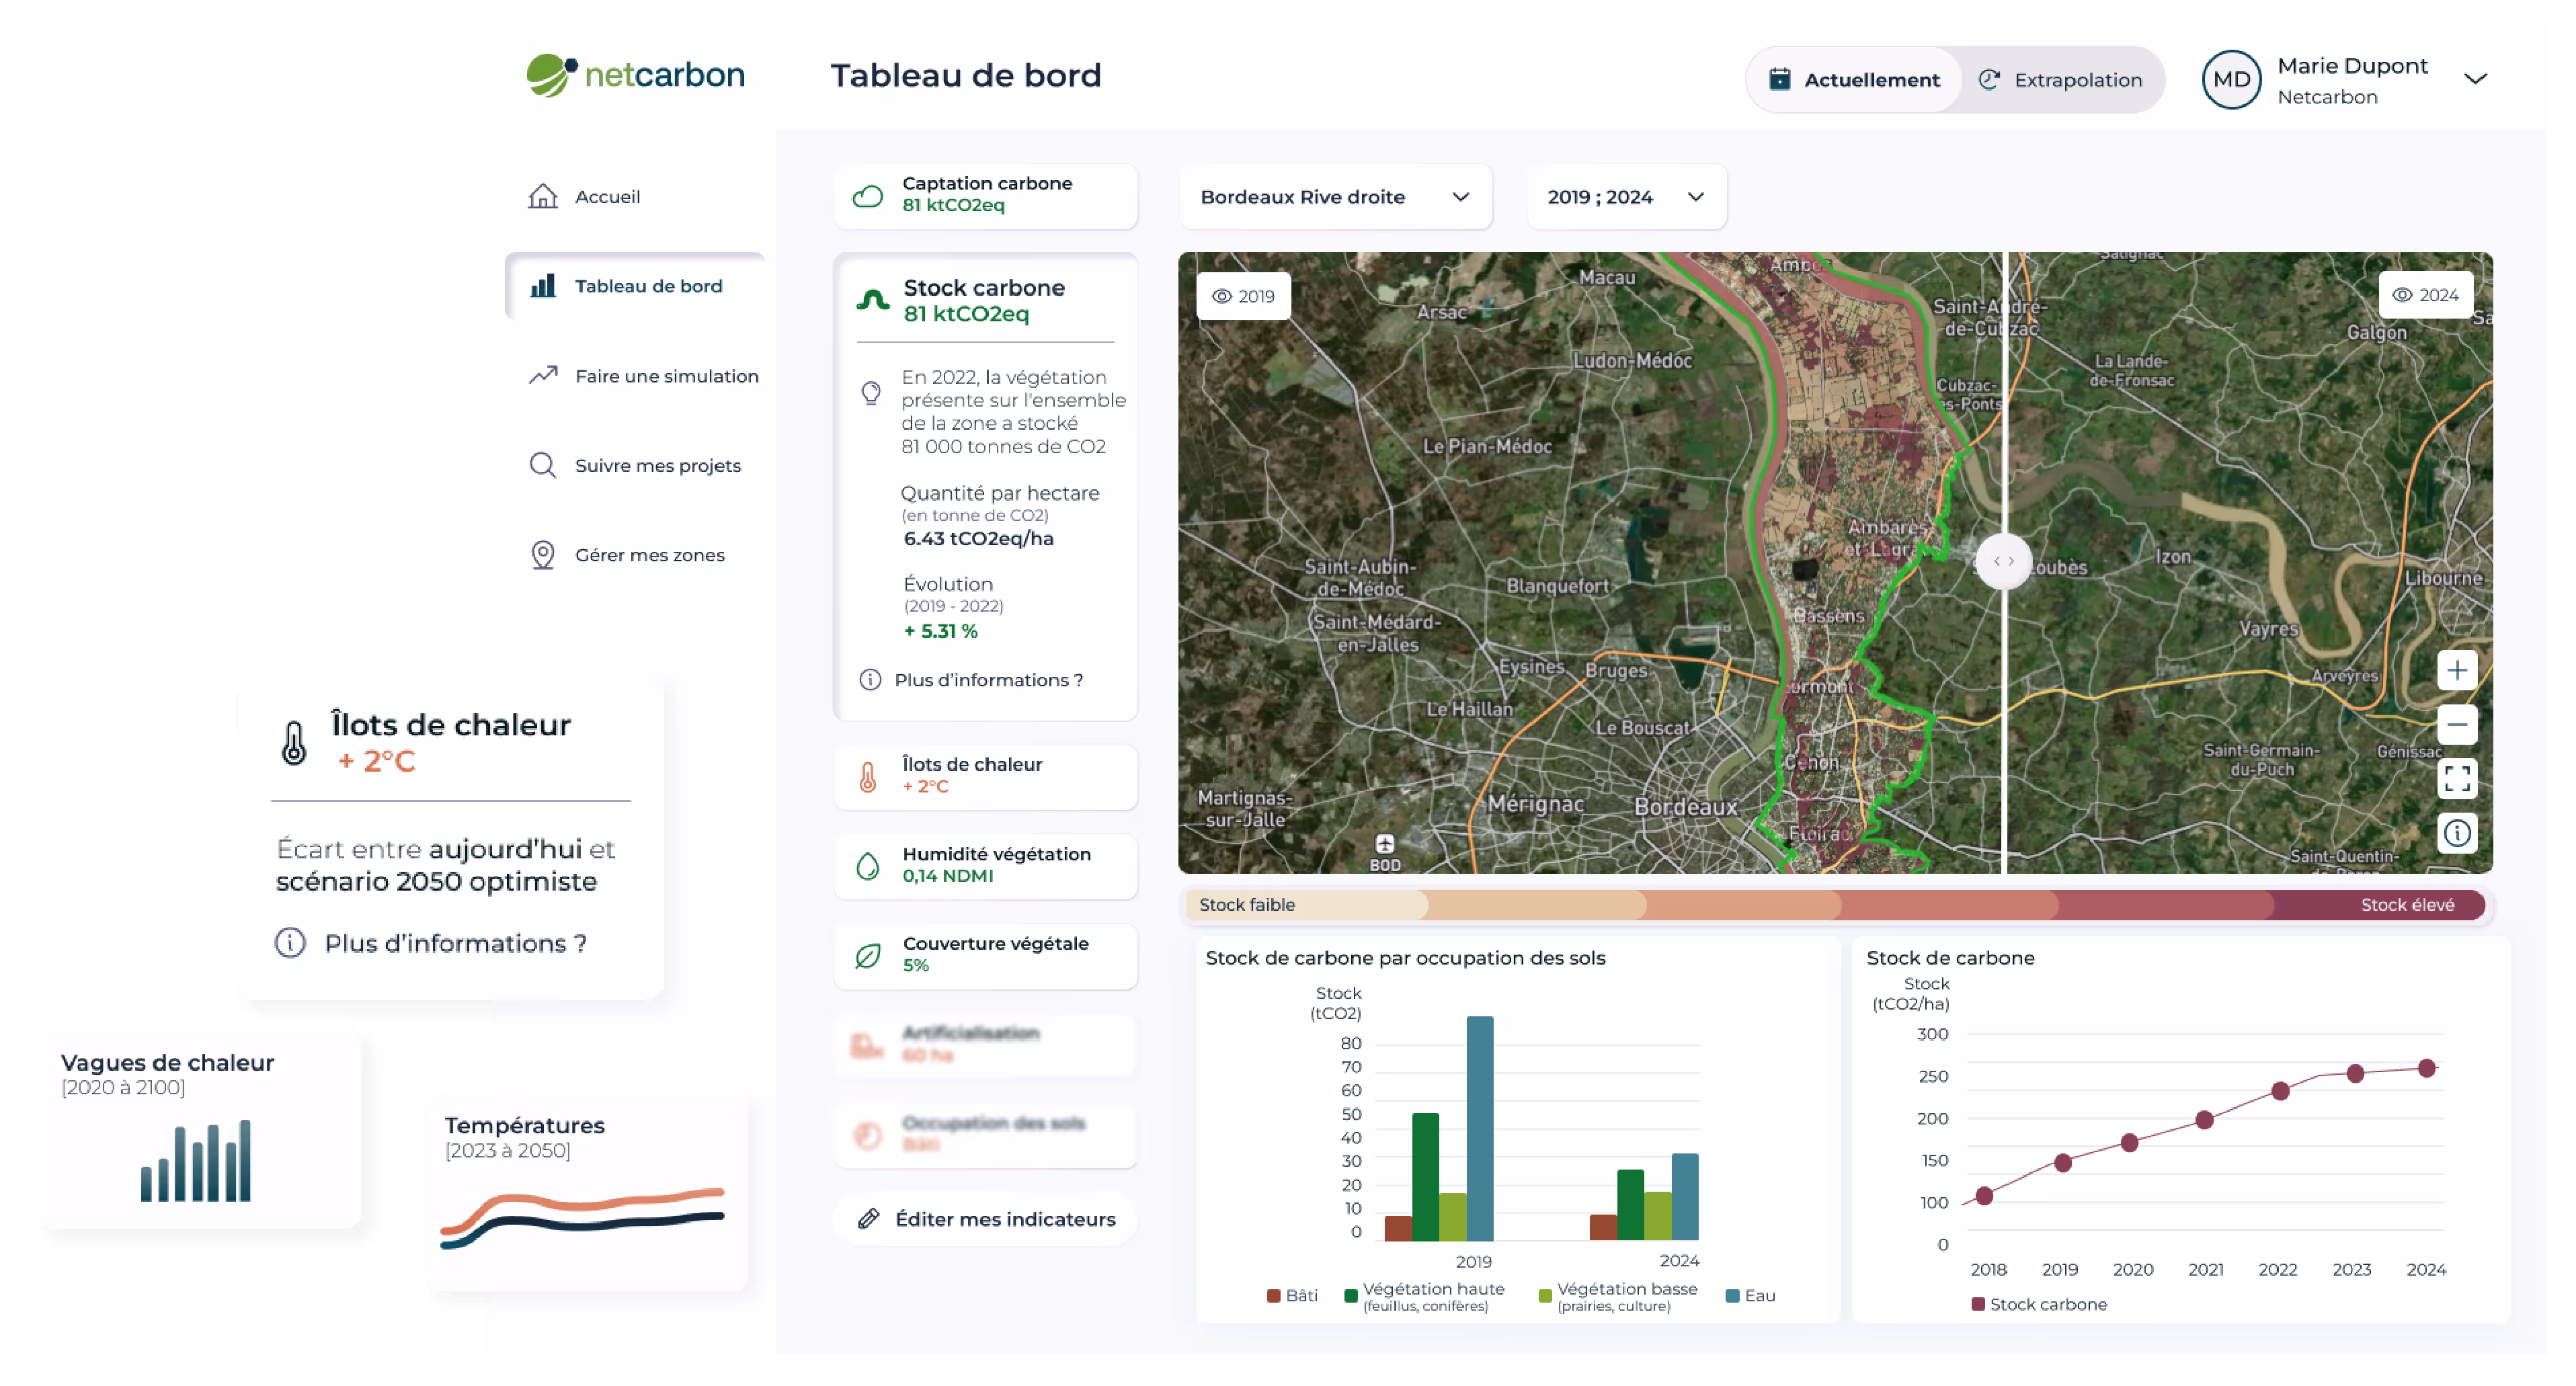
Extrapolating the trend
Which of my assets will be most exposed to heat islands?
Project temperature trends in your zone up to 2100 based on various IPCC scenarios.
A real decision-making tool enabling you to anticipate risks, prioritize your actions and choose the right species.
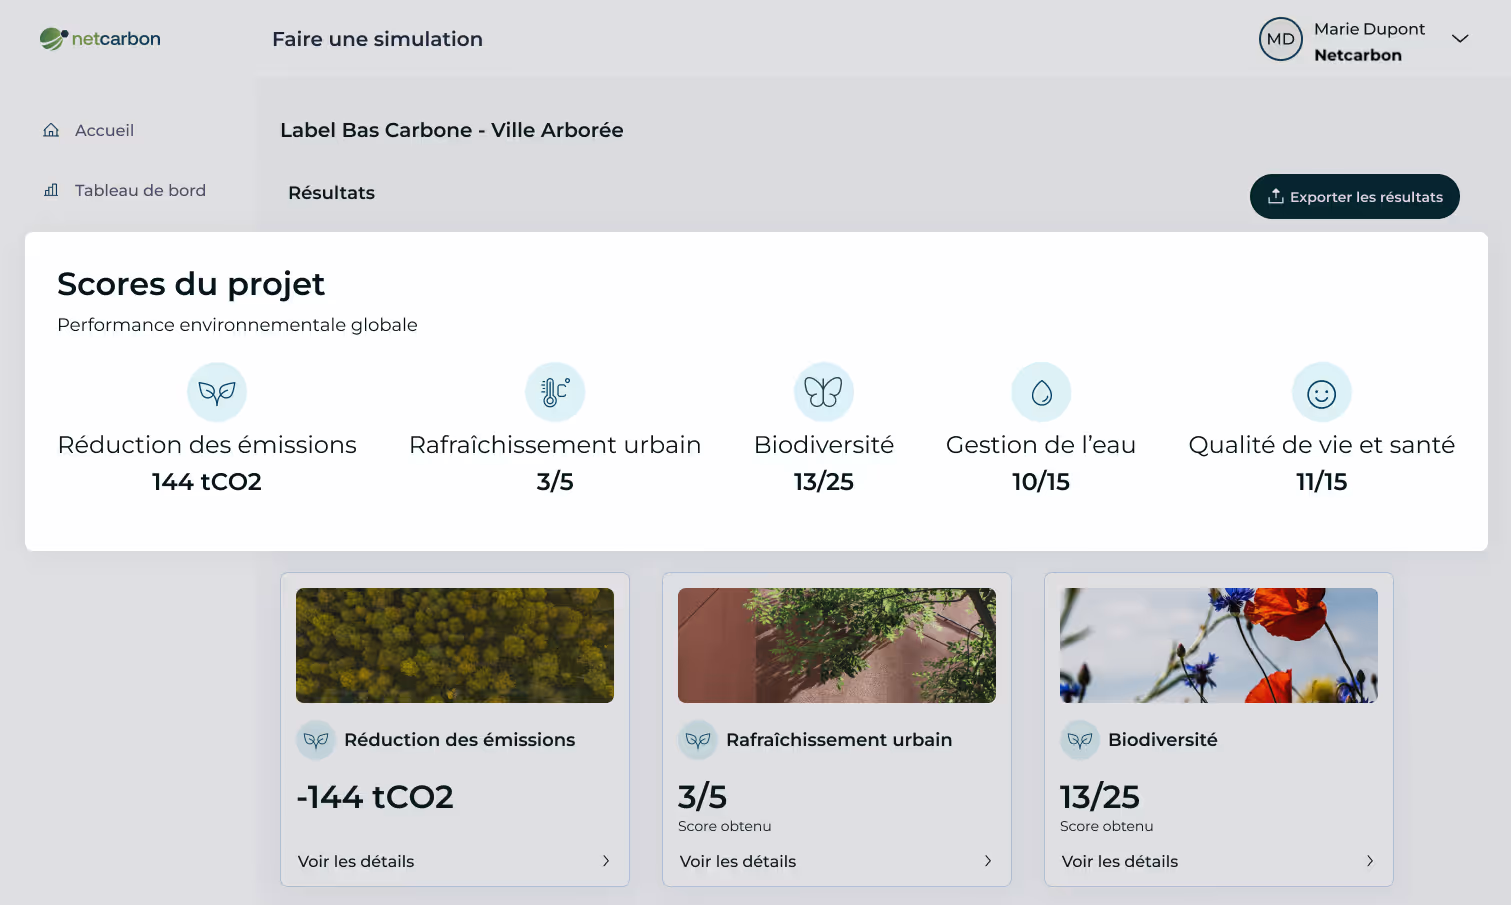
Certify your projects
Valorize your actions via carbon credits or directly in your Carbon Footprint using recognized methods such as the Label Bas Carbone Ville Arborée and GHG protocol.
Find out more about the application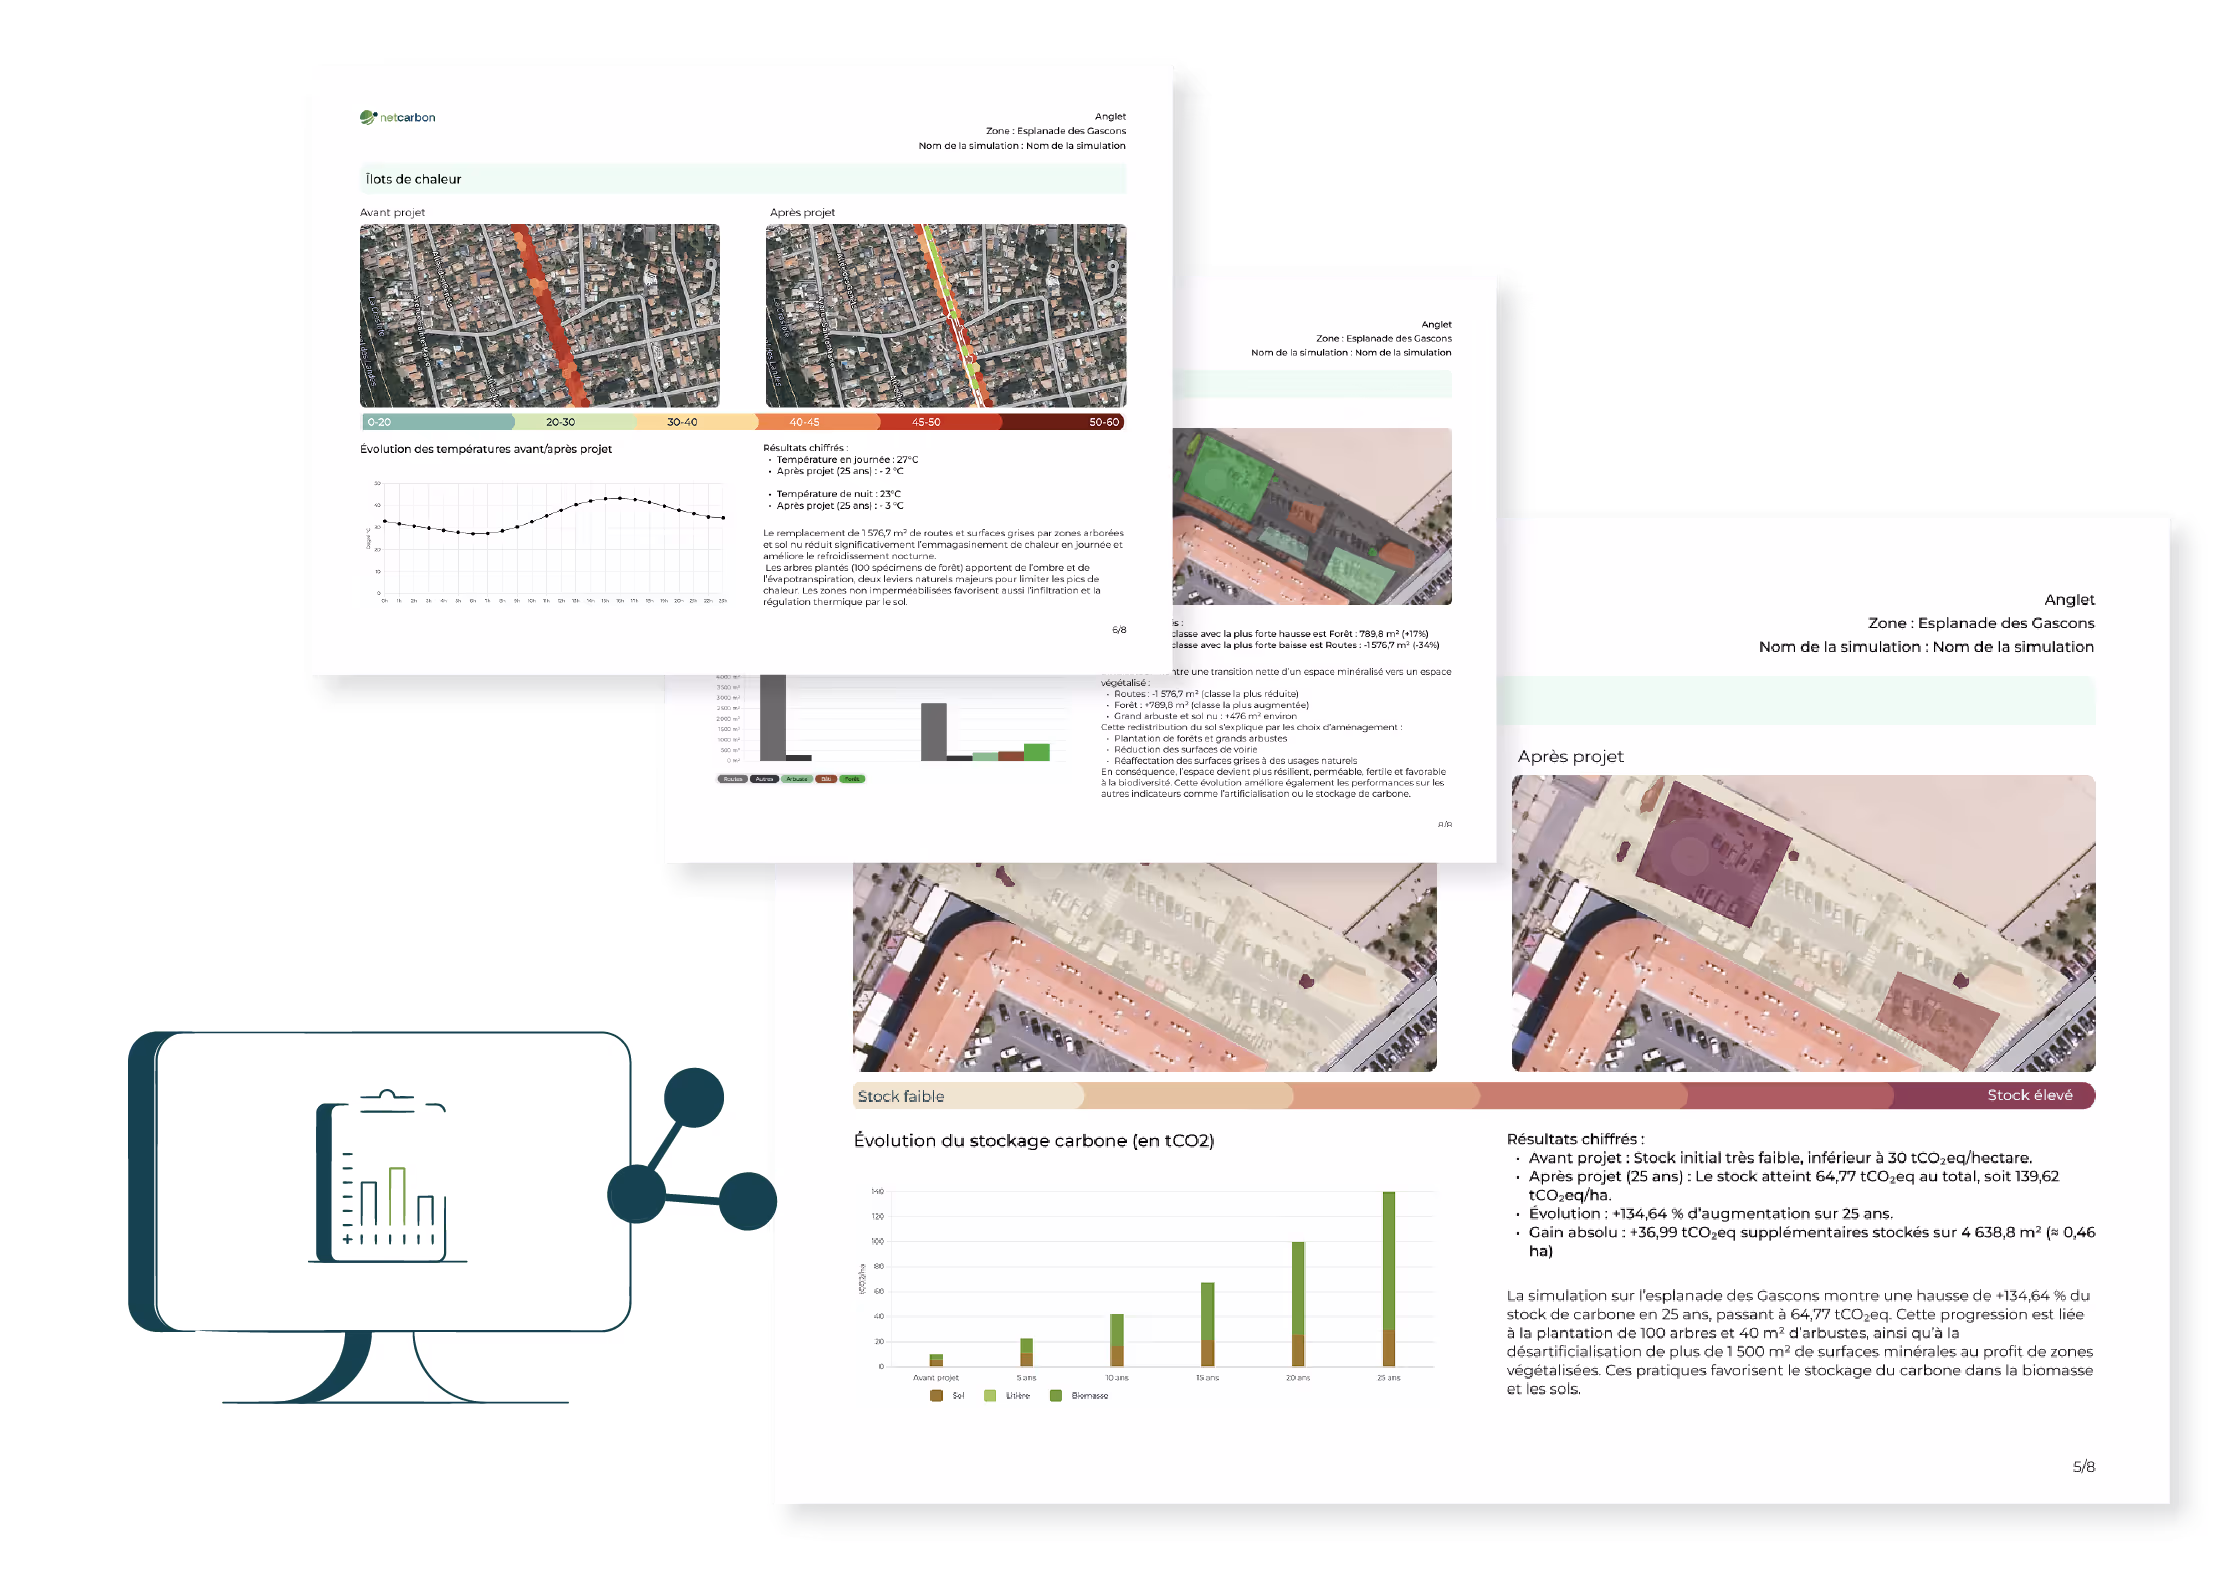
Share your results
Understand and communicate your results easily with the Netcarbon application: explanations and analysis summaries are available on a dedicated web page.
You own your data: you can export from the application, integrate into your own tools, or distribute as Open Data.


.webp)