Rule 3-30-300: The New European Standard for Evaluating Urban Greening

A new joint study by the European Commission’s Joint Research Center (JRC) and the University of Copenhagen, published on April 13, 2026, in *Nature Communications*, presents an indisputable finding: only 13.5% of European city dwellers live in an environment that fully complies with the 3-30-300 rule, and 21% of them fail to meet any of its three criteria. Beyond the statistics, the study reveals a “green divide” that overlaps with the continent’s geographic and socioeconomic divides. For French “ Local authorities ,” this study offers a new framework—and an operational management tool—for structuring their greening strategy through 2030.
Rule 3-30-300, in a nutshell
Formulated by the Nature Based Solutions Institute, the 3-30-300 rule has gradually been adopted as a benchmark by urban authorities and international institutions. It establishes three simple, measurable thresholds that are directly linked to the documented benefits of urban green spaces for health, climate, and social cohesion:
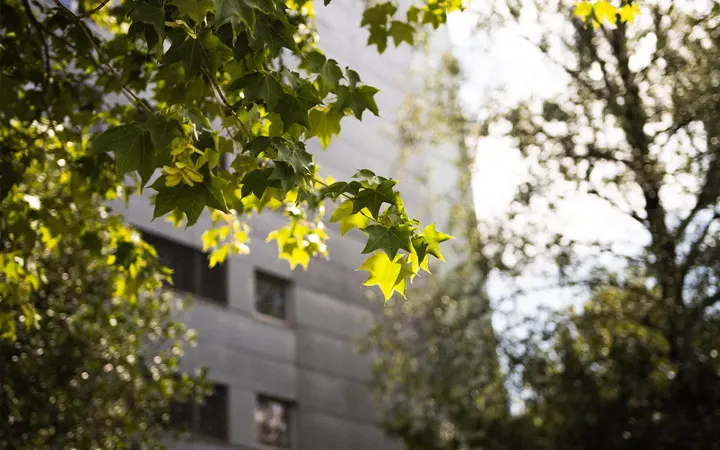
- 3 trees visible from each apartment
- 30% tree cover in each neighborhood
- A maximum of 300 meters between a residence and a high-quality green space of at least 1 hectare
3 Trees: Nature Within Sight
The first threshold addresses a factor that environmental psychology has extensively documented: simply being able to see trees from home reduces stress, improves sleep quality, and increases feelings of well-being. Three trees represent the minimum threshold below which these psychological benefits disappear.
30% canopy cover: the threshold for cooling
This is the indicator most directly linked to combating urban heat islands. A neighborhood where the tree canopy covers less than 30% of the land area quickly becomes an overheated zone in the summer. Above that threshold, the cooling effect becomes measurable: evapotranspiration from trees can lower local perceived temperature by several degrees, as illustrated by impact studies conducted on renaturation projects.
300 meters: the distance of everyday life
Beyond 300 meters, the number of visitors to a green space declines rapidly. This is the walking distance that most city dwellers are willing to travel for regular use. The rule also requires that this space be of high quality—that is, at least 1 hectare in size and open to the public.
What the JRC study of 862 European cities reveals
Researchers analyzed 862 European cities by combining high-resolution satellite imagery with detailed socioeconomic data. Three key findings emerged.
A standard that is rarely met
On a continental scale, 13.5% of the urban population lives in an area that meets all three criteria. More alarmingly, 21% of urban residents do not meet any of the three thresholds. Over the past decade (2010–2020), Europe’s urban population grew by 16% and the urban footprint expanded by 2.3%, but urban green spaces declined by 0.3% and tree canopy cover by 1.6%. The gap is widening between rising social demand and dwindling green spaces.
A North-South Climate Divide
Compliance varies dramatically by latitude. Northern and continental cities lead the way: Helsinki at 57%, Hamburg at 55%, and Kraków at 47%. At the other end of the spectrum, Mediterranean cities bring up the rear: Athens at 3.3%, Palermo at 1.9%, and Córdoba at 1.0%. The study attributes this gradient to climatic conditions: the humid climates of the north naturally support the vegetation required by the regulation, whereas the arid Mediterranean climates make the goal much more costly to achieve without irrigation and intensive management.
For French “ Local authorities ,” this assessment is rooted in the country’s geography: municipalities in the south and along the Mediterranean arc face a structural disadvantage that must be factored into the restoration plan by prioritizing suitable tree species and aligning the strategy with stormwater management and the “ depaving.”
An equally pronounced economic divide
The economic analysis is unequivocal. Cities in the lowest quartile of GDP per capita have a median compliance rate of less than 10 percent. The wealthiest cities have a median rate of 15 to 20 percent, with some exceeding 45 percent. At the sub-urban level, the correlation holds true: higher disposable income corresponds to significantly greater access to nature.
Rule 3-30-300 is therefore not only an environmental indicator; it is also an indicator of territorial equity. A socially just greening policy must prioritize under-served working-class neighborhoods, rather than merely continuing to beautify historic downtown areas.
Why the 3-30-300 Rule Is Essential in Public Policy
Several European regulatory frameworks now enshrine the goal of urban greening and are converging on the 3-30-300 framework as an operational guideline.
- The European Green Deal sets the goal of climate neutrality by 2050 and identifies nature in cities as a key driver of adaptation.
- The European Nature Restoration Regulation, adopted in 2024 and legally binding, requires European cities to halt the loss of green spaces and tree cover by 2030 and then demonstrate a continuous increase.
- The Green City Accord commits signatory cities to specific goals regarding biodiversity, air quality, water, noise, and waste.
At the national level in France, the 3-30-300 rule aligns naturally with existing requirements: the Climate and Resilience Act and the Net-Zero Emissions (Zero Net Land Take , or ZAN) target, the Territorial Climate-Air-Energy Plans (local climate plan (PCAET)), the Nature in the City Plans, and, for committed municipalities, the Label Bas Carbone (French low-carbon label) Ville Arborée. Above all, it provides a common framework for steering efforts, which can be translated into clear territorial targets that are understandable to both elected officials and residents.
Measuring the 3-30-300: The Challenge of Data at the Regional Level
Announcing a 3-30-300 target is one thing. Actually measuring it at the level of a municipality, a neighborhood, or even a city block is quite another. This is precisely where high-resolution geospatial data makes all the difference.
Three layers of information to produce
Assessing compliance with 3-30-300 involves cross-referencing:
- Inventory and mapping of tree cover —where are the trees located, what is their footprint, and what is the canopy cover percentage per grid cell (typically 200 m × 200 m or per IRIS district)?
- Mapping high-quality public green spaces —which spaces larger than 1 hectare are accessible, and what percentage of the population lives within 300 meters of them?
- Cross-referencing with housing data —how many residential buildings actually have 3 trees visible from their facades?
These layers are almost never available in a consistent format in existing databases at Local authorities. They require a detailed analysis ofaerial and satellite imagery, as well as processing tailored to the scale of the territory.
From Imaging to Decision-Making
Netcarbon 's methodology makes it possible to generate these indicators on a large scale, in just a few weeks, without deploying ground-based sensors. Using high-resolution aerial imagery, the algorithms identify and classify elements of the urban landscape—buildings, impervious surfaces, deciduous trees, conifers, lawns, bare soil, and water bodies—with validated accuracy levels: for example , 86.6% accuracy for deciduous trees, 84.7% for impervious areas, and 96.1% for water bodies.
The benefit of this approach is that it moves from a qualitative assessment to a quantitative monitoring system that is comparable year over year and can be broken down by neighborhood. A local government can then:
- Map the areas that fall short on each of the three 3-30-300 criteria
- Identify priority populations by cross-referencing income and heat vulnerability data
- Compare several land-use scenarios before construction begins to assess the expected gains in tree canopy cover, carbon stocks, and temperature reduction
- Track progress over time and provide accountability in the context of the “ local climate plan (PCAET),” CSRD reporting, or applications for European funding
From Assessment to Project: Three Concrete Examples
The 3-30-300 approach is directly linked to operational development projects. Here are three examples from studies Netcarbon :
- Marseille — Bougainville Park (2.1 ha): The creation of a downtown park, optimized from the design phase onward, resulted in a modeled temperature reduction of −15.4 °C, an increase of 286 metric tons of CO₂ sequestered, and an increase of 1.3 hectares of permeable surface area. Based on the 3-30-300 canopy criterion, the project pushes the neighborhood above the 30% threshold.
- Antibes — Les Combes (2.6 ha): A residential development project featuring a landscaped park has received Label Bas Carbone (French low-carbon label) Ville Arborée, with modeled values of −5.5 °C and +52.3 tCO₂ over 25 years. The preliminary simulation helped guide the selection of plant species to maximize canopy cover.
- Bordeaux — PRU Bel Air (4.8 ha): An initial study identified a significant loss of carbon stocks in the project’s original design. The plan was revised before the project’s operational launch, thereby preventing an urban renewal project that would have negatively impacted the neighborhood’s 3-30-300 indicator.
In all three cases, advance quantification helped avoid the classic pitfall of a “poorly designed green project”: adding greenery, yes, but with plant species, densities, and a layout that actually deliver the expected benefits.
What " Local authorities " Can Do About It Right Now
The JRC study brings the 3-30-300 framework to the European level, but it can be immediately adapted to the scale of a municipality or an EPCI. Four concrete actions:
- Establish a 3-30-300 “ baseline assessment ” across the entire territory to identify red zones (where none of the criteria are met) and the affected population.
- Cross-reference with social indicators (income, heat vulnerability, population density) to guide a socially just renaturation strategy.
- Prioritize the following projects: peri-urban forests, plantings on private land, the " depaving " of schoolyards and parking lots, and the greening of buildings in densely populated areas (roofs, walls, balconies).
- Track progress annually: Repeated measurements help demonstrate the impact of public policies and provide data for regulatory reports (local climate plan (PCAET), CSRD, funding applications).
Rule 3-30-300 does not replace existing regulatory frameworks; rather , it provides them with a common framework that is understandable to both elected officials and citizens. This is precisely what makes it, by 2030, one of the key indicators for European urban planning.
Netcarbon cartographie la canopée, les espaces verts et les zones de chaleur de votre commune à partir d'imagerie haute résolution. En quelques semaines, vous disposez d'un diagnostic objectivé, quartier par quartier, pour prioriser vos projets de renaturation et alimenter votre PCAET.